Atec Rohde-Schwarz_FSL Series User Manual
Page 8
R&S
®
FSL Spectrum Analyzer
Version 09.00, December 2008
8
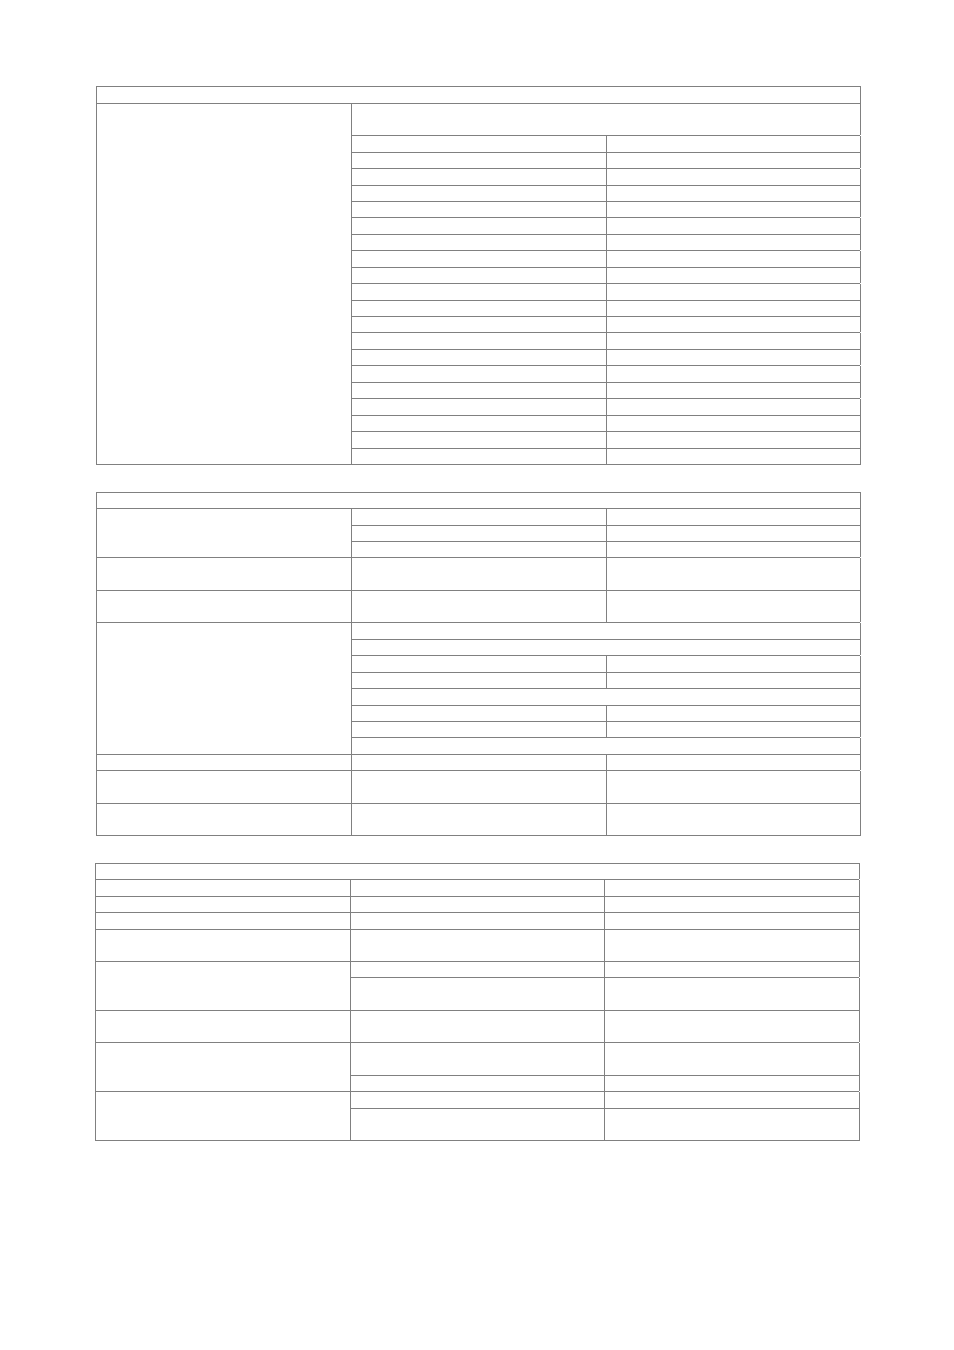
Displayed average noise level R&S
®
FSL18
0 dB RF attenuation, termination 50
Ω, RBW = 1 kHz, VBW = 1 Hz,
sample detector, log scaling, tracking generator OFF, normalized to 1 Hz
frequency
preamplifier = OFF
9 kHz to 1 MHz
<–100 dBm (1 Hz)
1 MHz to 10 MHz
<–115 dBm (1 Hz)
10 MHz to 50 MHz
<–130 dBm (1 Hz)
50 MHz to 3 GHz
<–140 dBm (1 Hz)
3 GHz to 12 GHz
<–136 dBm (1 Hz)
12 GHz to 18 GHz
<–130 dBm (1 Hz)
18 GHz to 20 GHz
<–123 dBm (1 Hz)
frequency
preamplifier = ON
9 kHz to 1 MHz
<–115 dBm (1 Hz)
1 MHz to 10 MHz
<–130 dBm (1 Hz)
10 MHz to 50 MHz
<–145 dBm (1 Hz)
50 MHz to 3 GHz
<–152 dBm (1 Hz)
3 GHz to 5 GHz
<–149 dBm (1 Hz)
5 GHz to 6 GHz
<–145 dBm (1 Hz)
frequency
preamplifier = ON, typical values
500 MHz
–162 dBm (1 Hz)
1 GHz
–161 dBm (1 Hz)
3 GHz
–158 dBm (1 Hz)
6 GHz
–152 dBm (1 Hz)
Immunity to interference
f
in
– 2 × 48.375 MHz
<–80 dBc, typ. –90 dBc
f
in
– 2 × 838.375 MHz
<–60 dBc, typ. –80 dBc
Image frequency
f
in
– 2 × 7158.375 MHz
typ. –60 dBc
Intermediate frequency
48.375 MHz, 838.375 MHz,
7158.375 MHz
<–60 dBc, typ. –80 dBc
Spurious response, inherent
f > 30 MHz, without input signal,
RF attenuation = 0 dB, RBW
≤ 10 kHz
<–90 dBm
related to local oscillators
f
≤ 6 GHz
∆f < 100 kHz
typ. –60 dBc
∆f ≥ 100 kHz
<–60 dBc
f > 6 GHz
∆f < 100 kHz
typ. –48 dBc
∆f ≥ 100 kHz
<–48 dBc
Spurious response
f = receive frequency
Spurious response
related to A/D conversion
typ. <–70 dBc
Spurious response
related to subharmonic of first LO
(spur at 7158.375 MHz – 2 × f
in
)
typ. –60 dBc
Spurious response
at mixer level <–10 dBm
related to harmonic of first LO
(spur at f
in
– 3579.1875 MHz)
typ. –60 dBc
Level display
Logarithmic level axis
10 dB to 100 dB
Linear level axis
0 % to 100 %/10 divisions
Number of traces
4
Trace detectors
max peak, min peak, auto peak, sample,
RMS, quasi peak, average
default value
501
Number of measurement points
range
125 to 32001
in steps of about a factor of 2
Trace functions
clear/write, max hold, average, min hold,
view
logarithmic level display
–80 dBm to 20 dBm
in steps of 2 dB, 5 dB or 10 dB
Setting range of reference level
linear level display
–80 dBm to 20 dBm, 0 % to 100 %
logarithmic level display
dBm, dBmV, dBµV, dBµA, dBpW
Units of level axis
linear level display
µV, mV, V, µA, mA, A, pW, nW, µW, mW,
W