10 statistics chart, 1 traffic comparison, Figure 33. cable diagnosis – Asus GigaX2008EX User Manual
Page 41: Figure 34. traffic comparison
31
GigaX2008EX L2 Managed Switch User Manual
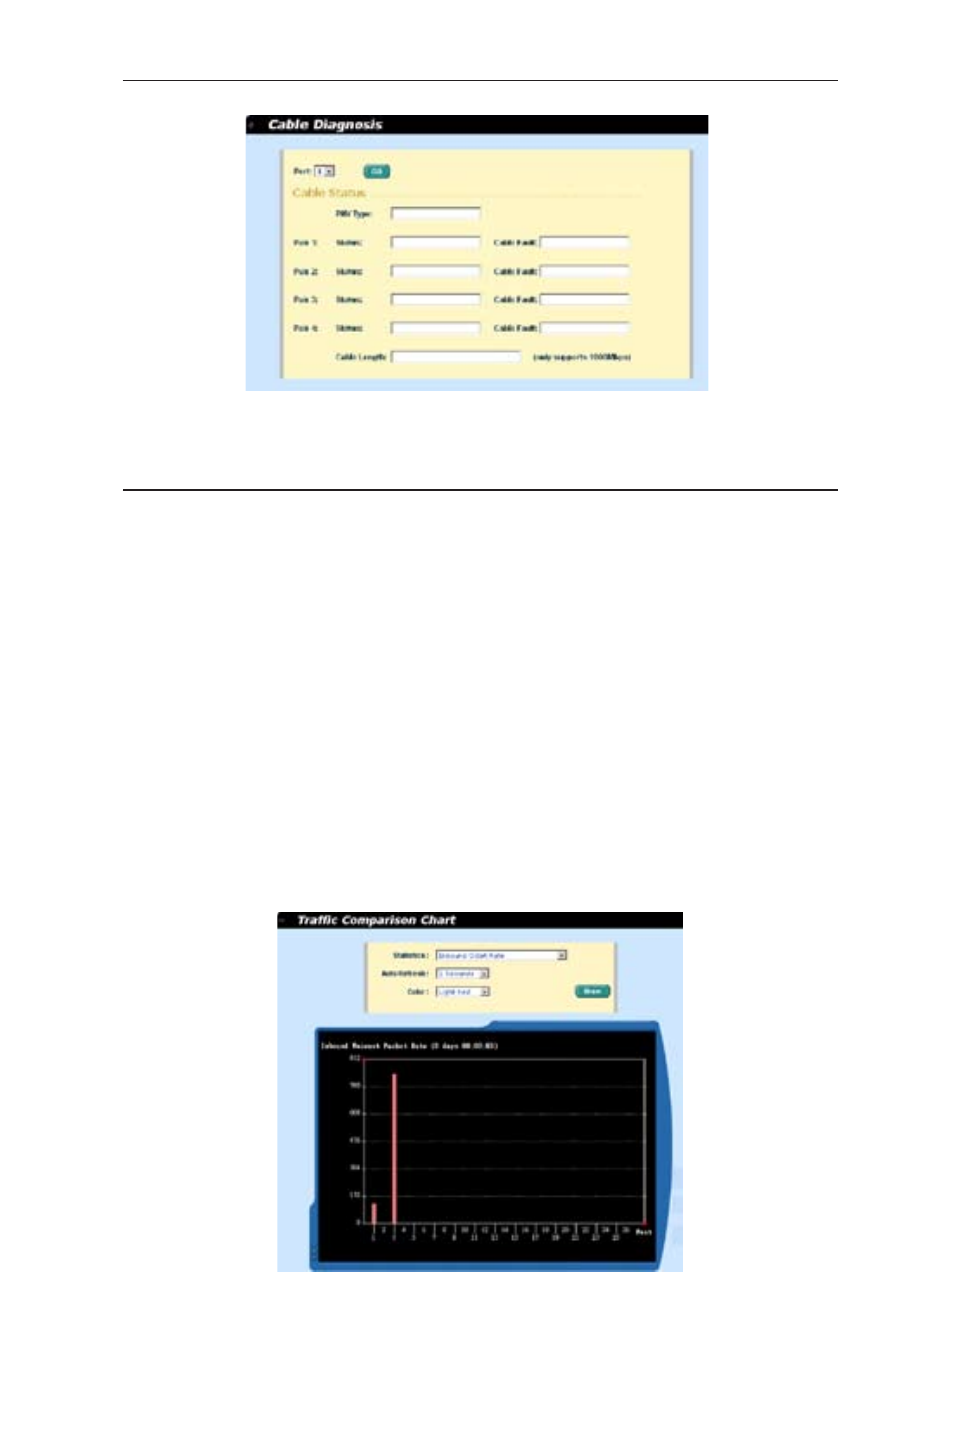
Figure 33. Cable diagnosis
4.10 Statistics Chart
The Statistics Chart pages provide network flow in different charts. You can
specify the period time to refresh the chart. You can monitor the network traffic
amount in different graphic chart by these pages. Most MIB-II counters are
displayed in these charts.
Click
Auto Refresh to set the period for retrieving new data from the switch.
You can differentiate the statistics or ports by selecting
Color. Finally, click on
Draw to let the browser to draw the graphic chart. Each new Draw will reset the
statistics display.
4.10.1 Traffic Comparison
This page shows the one statistics item for all the ports in one graphic chart.
Specify the statistics item to display and click the
Draw, the browser will show
you the update data and refresh the graphic periodically.
Figure 34. Traffic comparison