Characteristic curves, Continued) – GE Industrial Solutions EQW010-040 Series (Eighth-Brick) User Manual
Page 9
Data Sheet
October 5, 2013
EQW010-040 Series Power Modules
36 – 75Vdc Input; 1.0 to 12.0Vdc Output; 10 to 40A Output Current
LINEAGE
POWER
9
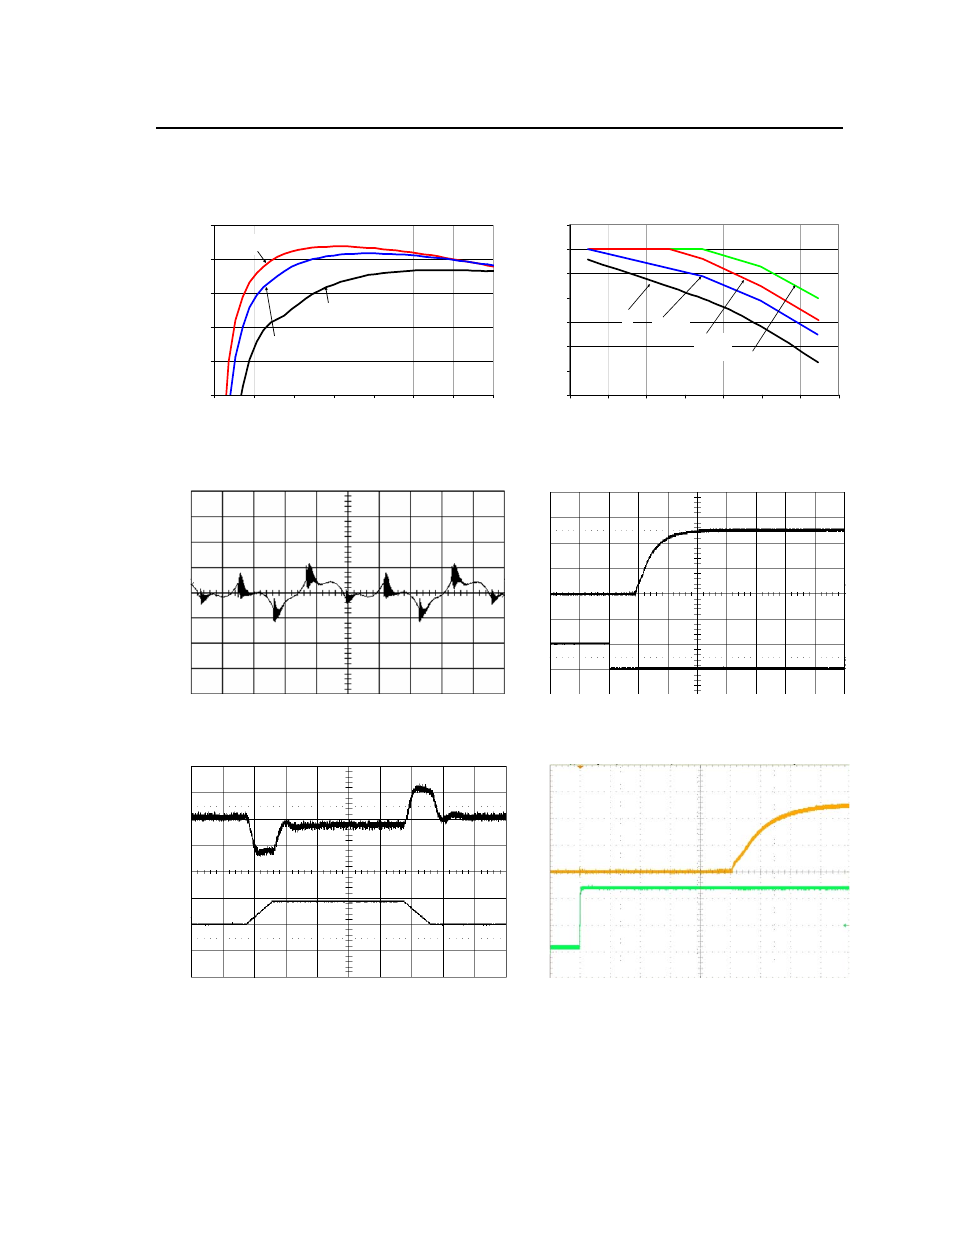
Characteristic Curves
(continued)
The following figures provide typical characteristics for the EQW035A0G (2.5V, 35A) at 25
o
C. The figures are
identical for either positive or negative remote On/Off logic.
EF
FICIE
NCY
,
(%)
70
75
80
85
90
95
0
5
10
15
20
25
30
35
Vin = 36V
Vin = 48V
Vin = 75V
OUTP
UT CURRE
NT,
Io
(
A
)
5
10
15
20
25
30
35
40
20
30
40
50
60
70
80
90
2.0 m/s
(400 LFM)
1.0 m/s
(200 LFM)
0.5 m/s
(100 LFM)
NC
OUTPUT CURRENT, I
O
(A)
AMBIENT TEMPERATURE, T
A
O
C
Figure 19. Converter Efficiency versus Output
Current.
Figure 22. Derating Output Current versus Local
Ambient Temperature and Airflow (direction shown
in Figure 63).
O
U
T
P
UT
VO
LT
AG
E
V
O
(V
) (2
0m
V
/d
iv
)
O
n/
O
ff VO
LT
A
G
E
O
U
T
P
UT
V
O
LT
A
G
E
V
On
/Of
f
(
V
) (
5V
/di
v)
V
O
(
V
) (1
V
/di
v)
TIME, t (1
s/div)
TIME, t (5ms/div)
Figure 20. Typical output ripple and noise (V
IN
=
V
IN,NOM
, I
o
= I
o,max
).
Figure 23. Typical Start-up Using Remote On/Off,
negative logic version shown (V
IN
= V
IN,NOM
, I
o
=
I
o,max
).
VO
LTAG
E
Io
(
A
) (1
0A
/d
iv
)
V
O
(V)
(1
0
0m
V
/d
iv
)
I
N
P
U
T
VO
LT
AG
E
O
U
T
U
T
VO
LT
AG
E
V
IN
(V)
(20V/di
v)
V
O
(
V
) (
1
.0
V
/d
iv
)
TIME, t (0.1ms/div)
TIME, t (4ms/div)
Figure 21. Transient Response to Dynamic Load
Change from 50% to 75% to 50% of full load.
Figure 24. Typical Start-up Using Input Voltage (V
IN
= V
IN,NOM
, I
o
= I
o,max
).