Windows/dialogs, Windows/dialogs 83 – Renesas Emulator Debugger M16C PC4701 User Manual
Page 97
7 Windows/Dialogs
83
7. Windows/Dialogs
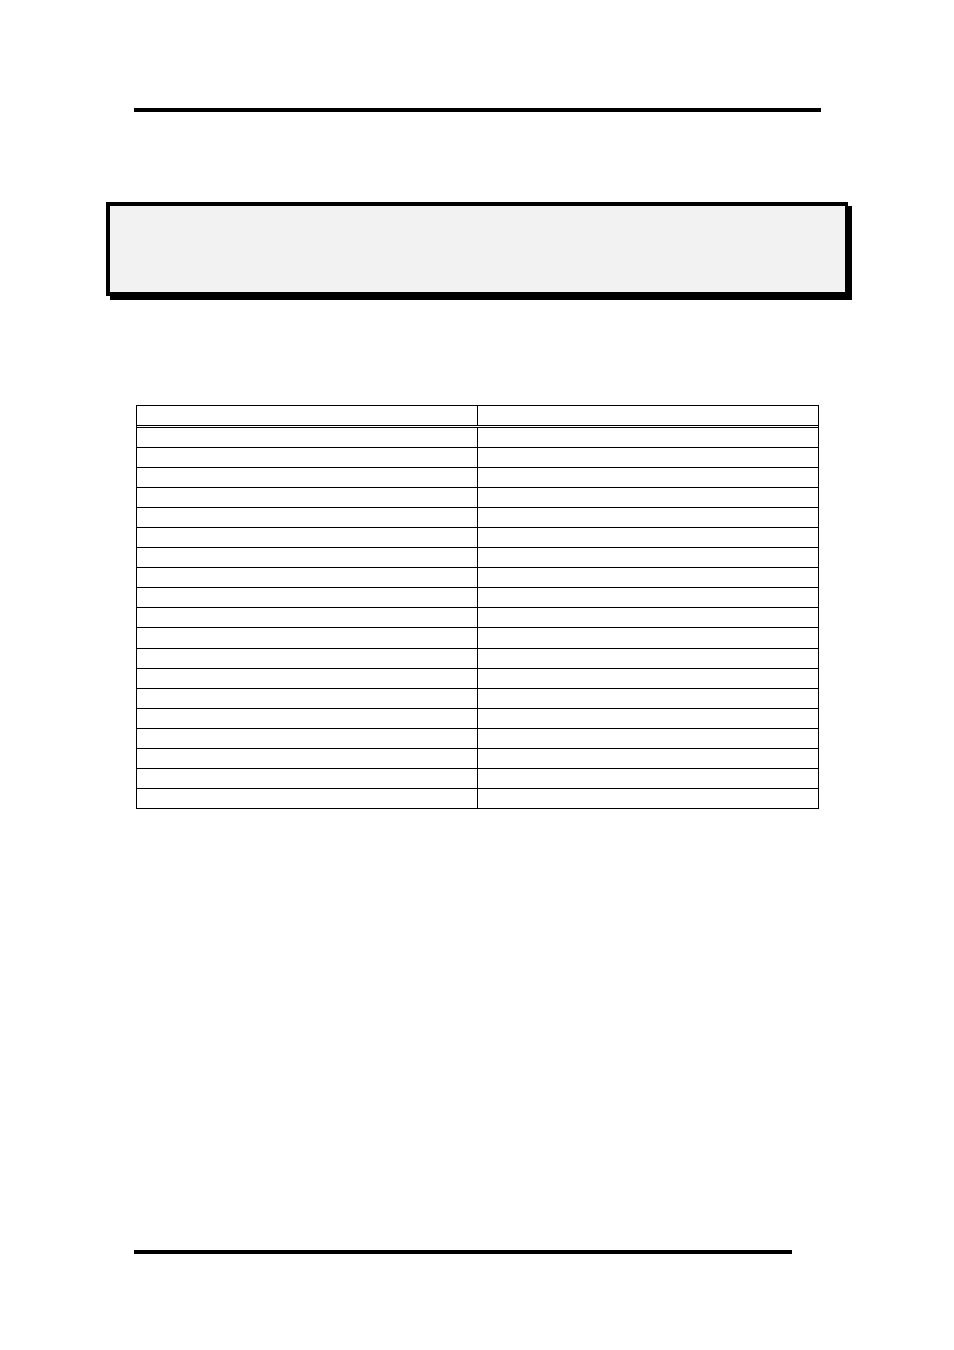
The window of this debugger is shown below.
When the window name is clicked, the reference is displayed.
Window Name
View Menu
RAM Monitor Window
[View]->[CPU]->[RamMonitor]
ASM Watch Window
[View]->[Symbol]->[ASMWatch]
C Watch Window
[View]->[Symbol]->[CWatch]
Coverage Wind w
o
[View]->[Code]->[Coverage]
Script Window
[View]->[Script]
S/W Break Point Setting Window
[View]->[Break]->[S/W Break Points]
H/W Break Point Setting Window
[View]->[Break]->[H/W Bre k Points]
a
Protect Window
[View]->[Break]->[Protect]
Trace Point Setting Window
[View]->[Trace]->[Trace Points]
Time Measurement Window
[View]->[Trace]->[Time Measure]
Trace Window
[View]->[Trace]->[Trace]
Data Trace Window
[View]->[Trace]->[Data Trace]
GUI I/O Wind w
o
[View]->[Graphic]->[GUI I/O]
MR Window *
[View]->[RTOS]->[MR]
MR Trace Window *
[View]->[RTOS]->[MR Trace]
MR Analyze Window *
[View]->[RTOS]->[MR Analyze]
MR Task Pause Window *
[View]->[RTOS]->[MR Task Pause]
Task Trace Window
[View]->[RTOS]->[Task Trace]
Task Analyze Window
[View]->[RTOS]->[Task Analyze]
*: The 740 debuggers are not supported.
For the reference of the following windows, refer to the help attached to a High-performance
Embedded Workshop main part.
•
Differences Window
•
Map Window
•
Command Line Window
•
Workspace Window
•
Output Window
•
Disassembly Window
•
Memory Window
•
IO Window
•
Status Window
•
Register Window
•
Image Window
•
Waveform Window
•
Stack Trace Window