1 extended menus – Renesas Emulator Debugger M16C PC4701 User Manual
Page 245
7 Windows/Dialogs
231
The grid lines are displayed using the start marker as the radix point.
The scale is displayed, using the time at which the start marker is positioned as 0, with the left
(forward in time) set to "minus" and the right (backward in time) set to "plus".
The grid lines allow you to roughly understand the interrupt occurrence cycle and process time.
The interval time width of the displayed grid lines appears in the "Grid" area of the status bar.
The time value in the Task Trace window means the execution elapsed time using the program
execution start time as 0 in all the cases.
On the contrary, the numeric value above the grid lines (scale) in the Task Trace window is a relative
value using the start marker as 0 (the grid interval is specified in the Value dialog). It has nothing to
do with the time value. (This is provided so that you can see the window easily.)
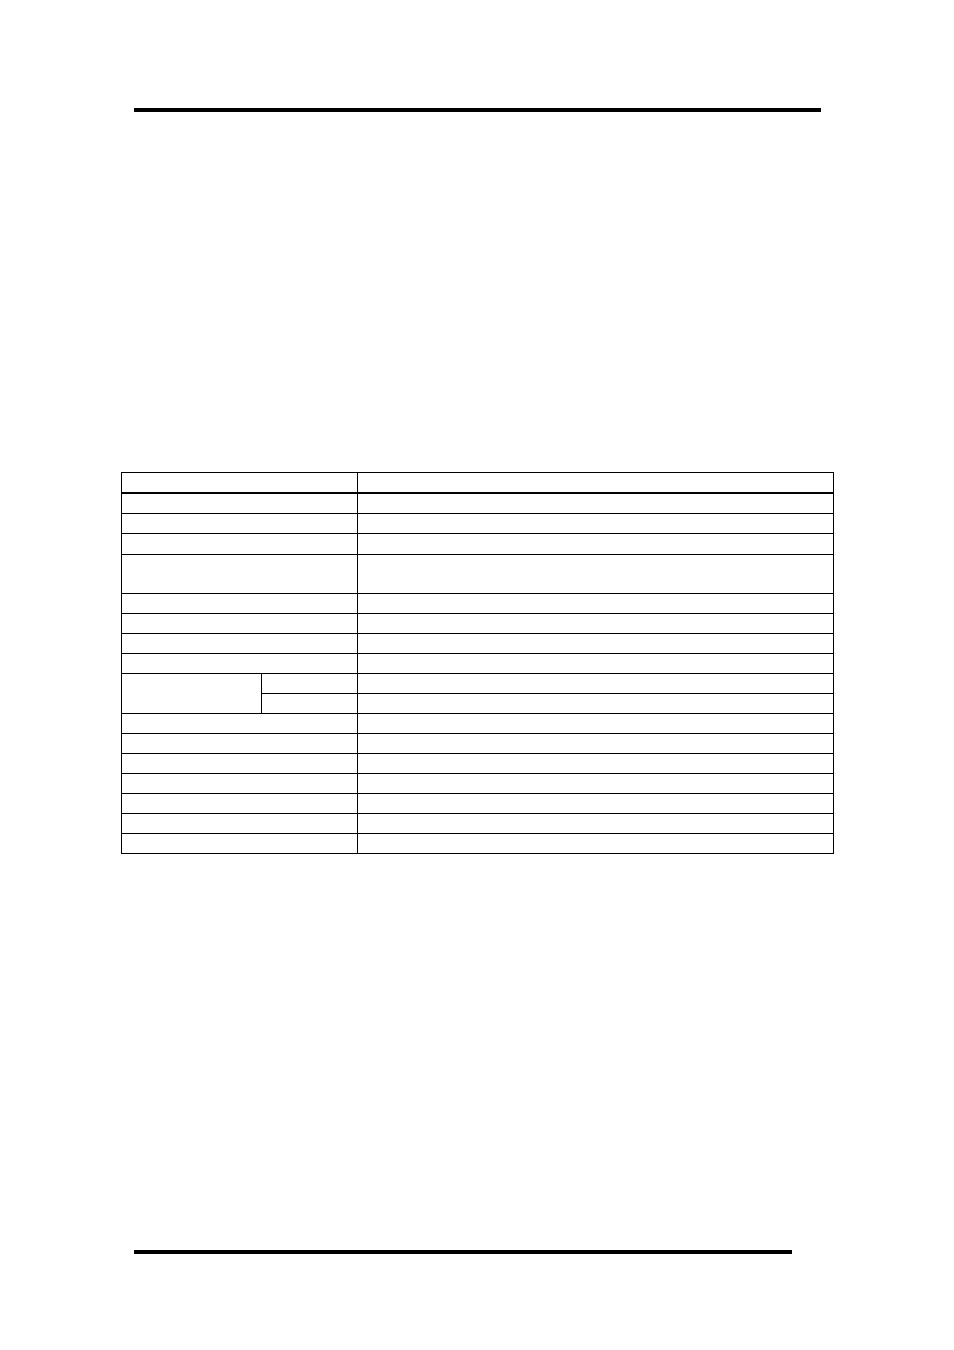
7.18.1 Extended Menus
This window has the following popup menus that can be brought up by right-clicking in the window.
Menu Function
Start Marker
Move the start marker in the display area.
End Marker
Move the end marker in the display area.
Indicator
Move the indicator in the display area.
Adjust
Adjust range of start and end marker to full width of display area
Adjust.
Expand
Increase scale factor of display.
Reduce
Decrease scale factor of display.
Trace Stop
Stop measuring.
Trace Restart
Restarts measuring.
After
Set measurement range condition to After.
Trace Range
Break
Set measurement range condition to Break.
Value... Set
value.
Color...
Change display color.
RTOS...
Set target RTOS information.
Toolbar display
Displays the toolbar.
Customize toolbar...
Opens the toolbar customize dialog box.
Allow Docking
Allows the window docking.
Hide
Hides the window.