16 diagnostic download, Diagnostic download, Figure 68 - csv download – Motorola PTP 400 Series User Manual
Page 134

132
The diagnostic plotter displays all of the data from the cascaded Histograms 1, 2 and 3. It
uses a bespoke x-axis with a compressed timeline so that resolution is not sacrificed. The
most recent data is shown to the right, and the oldest data to the left.
The most recent hour's worth of data from Histogram 1 is displayed between 0 minutes (0m)
and 60 minutes (60m) to the right of the x-axis; Data for the previous 24 hours from
Histogram 2 is displayed between 60 minutes (60m) and 25 hours (25h) in the middle of the
x-axis; Data for the previous 30 days from Histogram 3 is displayed between 25 hours (25h)
and 31 days (31d) to the left of the x-axis.
The Trace selection allows the user to control which traces are plotted.
As with other management pages the page refresh period can be used to interactively
monitor the wireless link.
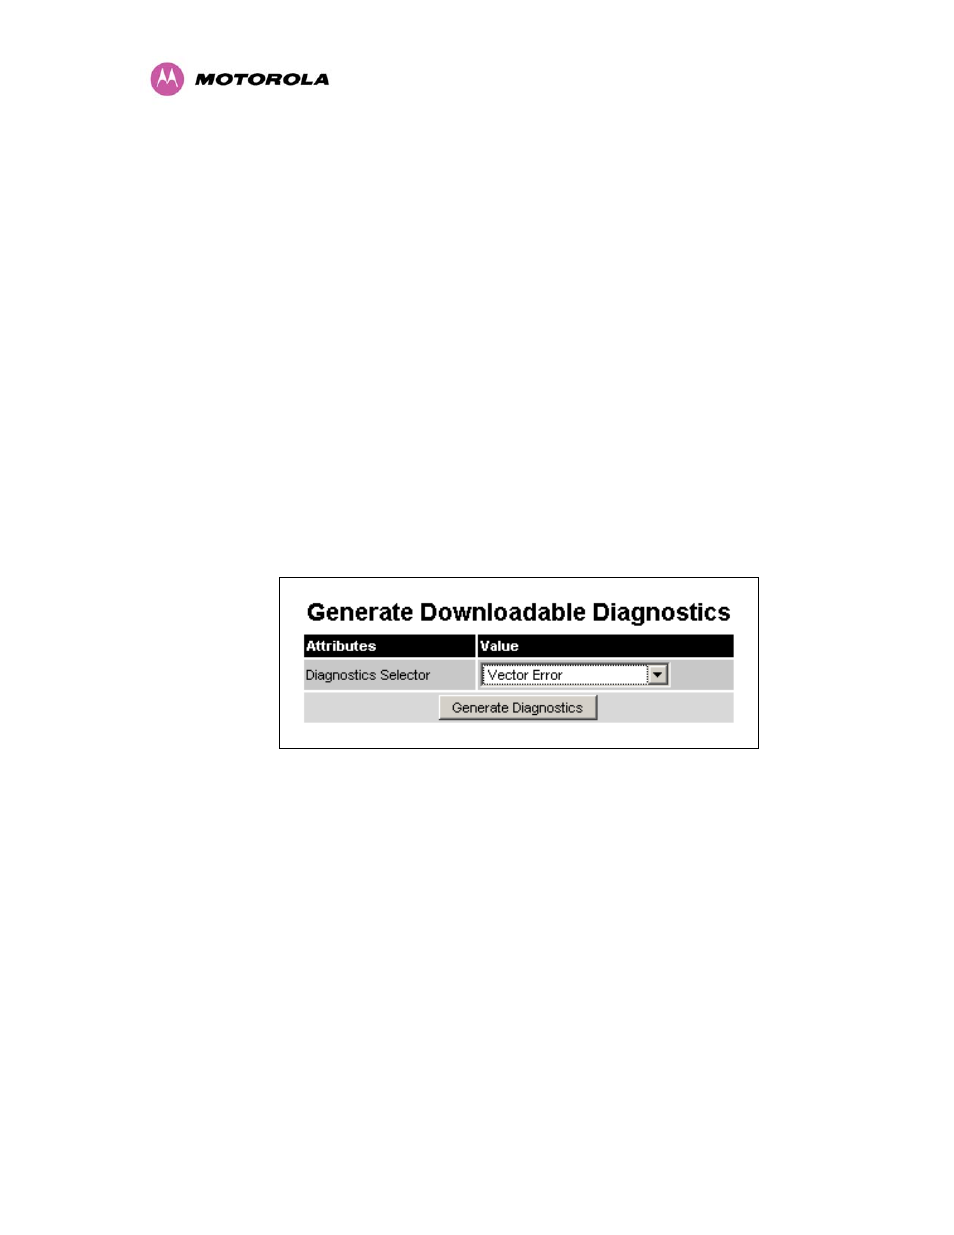
8.3.16 Diagnostic Download
The diagnostics Download page allows the system administrator to download snapshots of
system diagnostics.
Figure 68 - CSV Download
The following diagnostics are available:
• Vector
Error
• Rx
Power
• Tx
Power
• Signal Strength Ratio V/H
• Link
Loss
• Rx Data Rate
• Tx Data Rate
• Aggregate Data Rate
• Receive
SNR
• Rx
Gain
