4 print data 56, Figure 29 demand log view data 56, Print data 56, 63 – Fluke THE HART 1529 User Manual
Page 62: Print data, Figure 29, Demand log view data, 159c, 142c, 634c, 015c
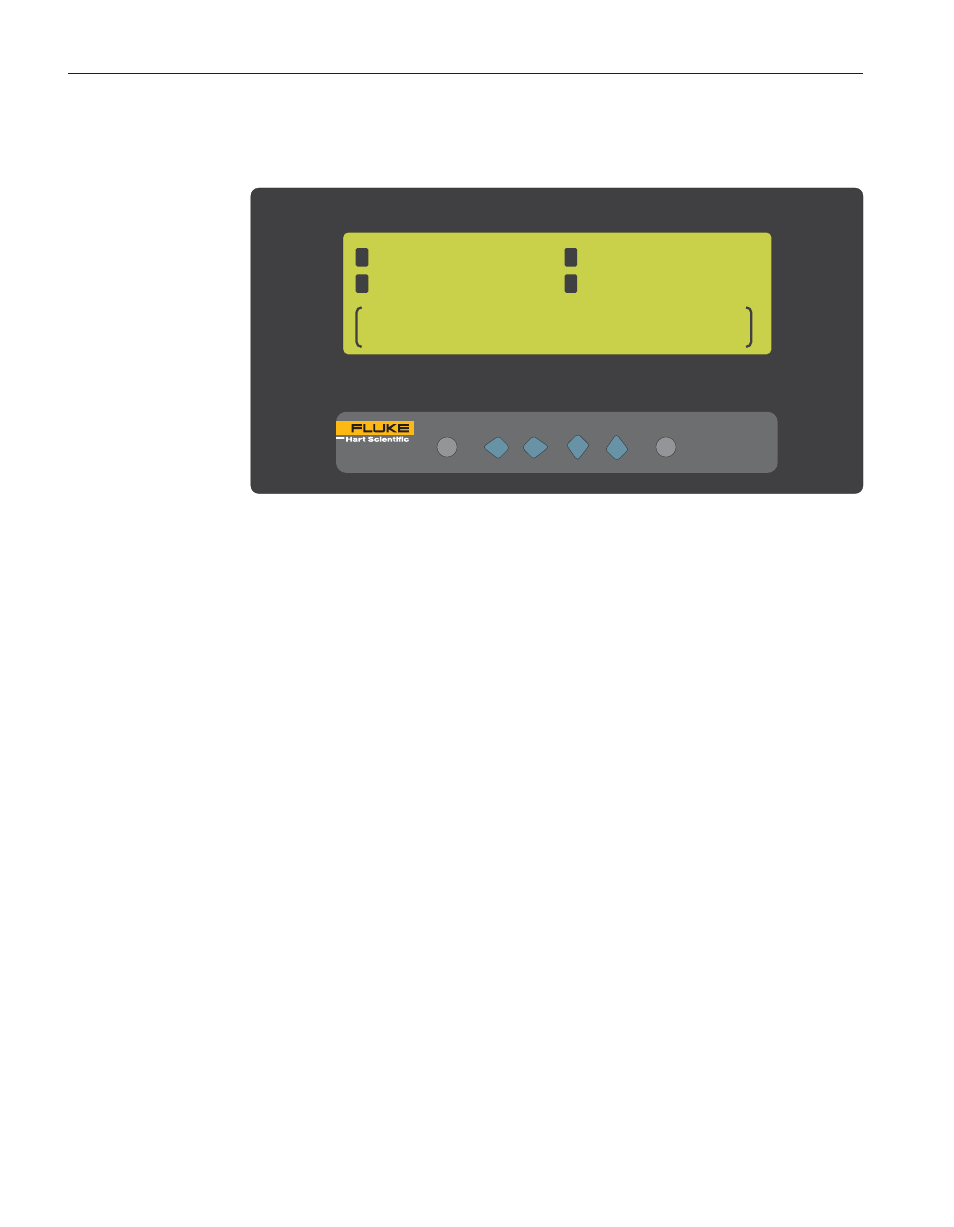
HISTORY function. When this function is selected, the bottom portion of the
display shows the demand log data.
Press the
UD buttons to scroll up and down through the stored readings se-
quentially. Press the
LR buttons to scroll up and down through the stored
readings sequentially by groups of 16. Press the Enter or Exit button to return
to the DEMAND LOG menu.
7.4.1.4
Print Data
The PRINT DATA function prints the demand log data for the selected label or
for all labels. The demand log data is printed to the serial port. When this func-
tion is selected, the bottom portion of the display allows you to select the label
of the demand log data to print or all data and the port. Select ALL DATA to
1529 Chub-E4 Thermometer Readout
User’s Guide
56
1
24.159C
3
24.142C
2
24.634C
4
24.015C
01:
DATA_01
02:
03:
24.156 C
04:
DATA_01
29.629 C
DATA_01
24.086 C
DATA_01
11:39:04
11:39:04
11:39:04
11:39:04
24.048 C
1
2
3
4
EXIT
ENTER / MENU
UNIT
CONTRAST
1529
CHUB E-4 THERMOMETER READOUT
Figure 29 Demand Log View Data