A-2 inverter effi ciency, A-3 ac input voltage to output charge amps, Efficiency wattage – Magnum Energy MS Series User Manual
Page 65: Vac input peak charge amps, Appendix a – specifi cations, Figure a-1, ms series effi ciency chart, Figure a-2, ms series vac input to charge amps
Page 56
©
2012 Magnum Energy, Inc.
Appendix A – Specifi cations
200
400
600
1000
1400
1800
2200
2600
3000
3400
3800
4200
MS4024
MS2812
MS2000/MS2012
60%
65%
70%
75%
80%
85%
90%
95%
MS2000/MS2012
MS2024
MS2812
MS4024
Efficiency
Wattage
MS2024
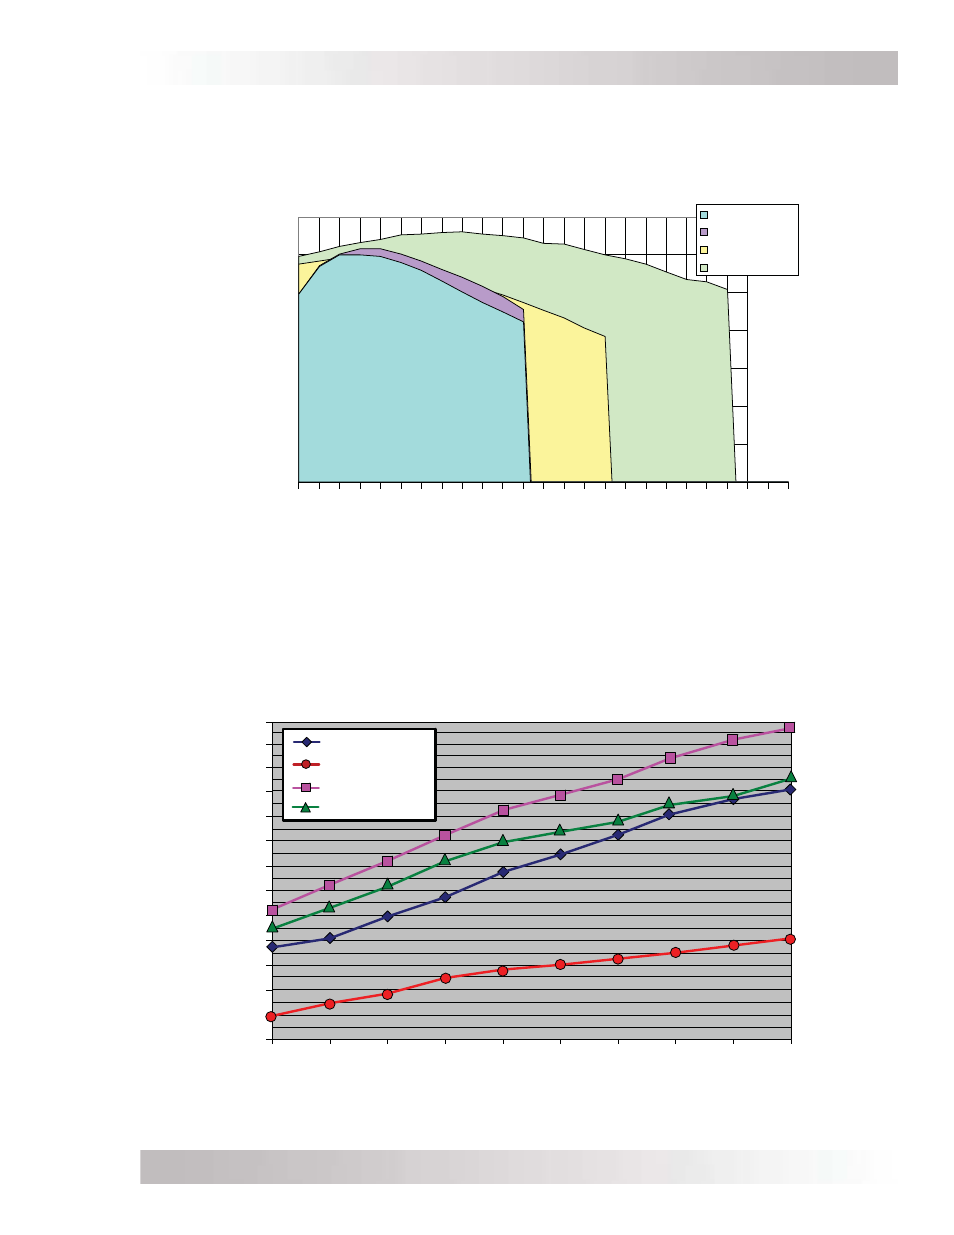
A-2 Inverter
Effi ciency
The following curves are plotted to show the MS Series’ effi ciency over the full power range and is
displayed as a percentage. This graph represents the inverter’s effi ciency while operating resistive
loads. Motors and other inductive loads run less effi ciently due to the impact of power factor losses.
Figure A-1, MS Series Effi ciency Chart
A-3 AC Input Voltage to Output Charge Amps
The following chart shows the expected charger output capability of the MS Series. The maximum
charge current is dependent on the AC input voltage and the inverter battery voltage. Note: The output
charger current shown is with the inverter battery voltage at nominal (i.e., 25.2 volts for MS4024).
Figure A-2, MS Series VAC Input to Charge Amps
135
140
150
160
95
105
115
125
135
VAC Input
Peak Charge Amps
100
110
120
130
140
155
145
130
125
120
115
110
105
100
95
90
85
80
75
70
65
60
55
50
45
40
35
30
MS2000/MS2012
MS2024
MS2812
MS4024