Service traffic distribution of an ip group, Figure 79, Service traffic distribution of an ip – H3C Technologies H3C SecCenter UTM Manager User Manual
Page 93: Group
85
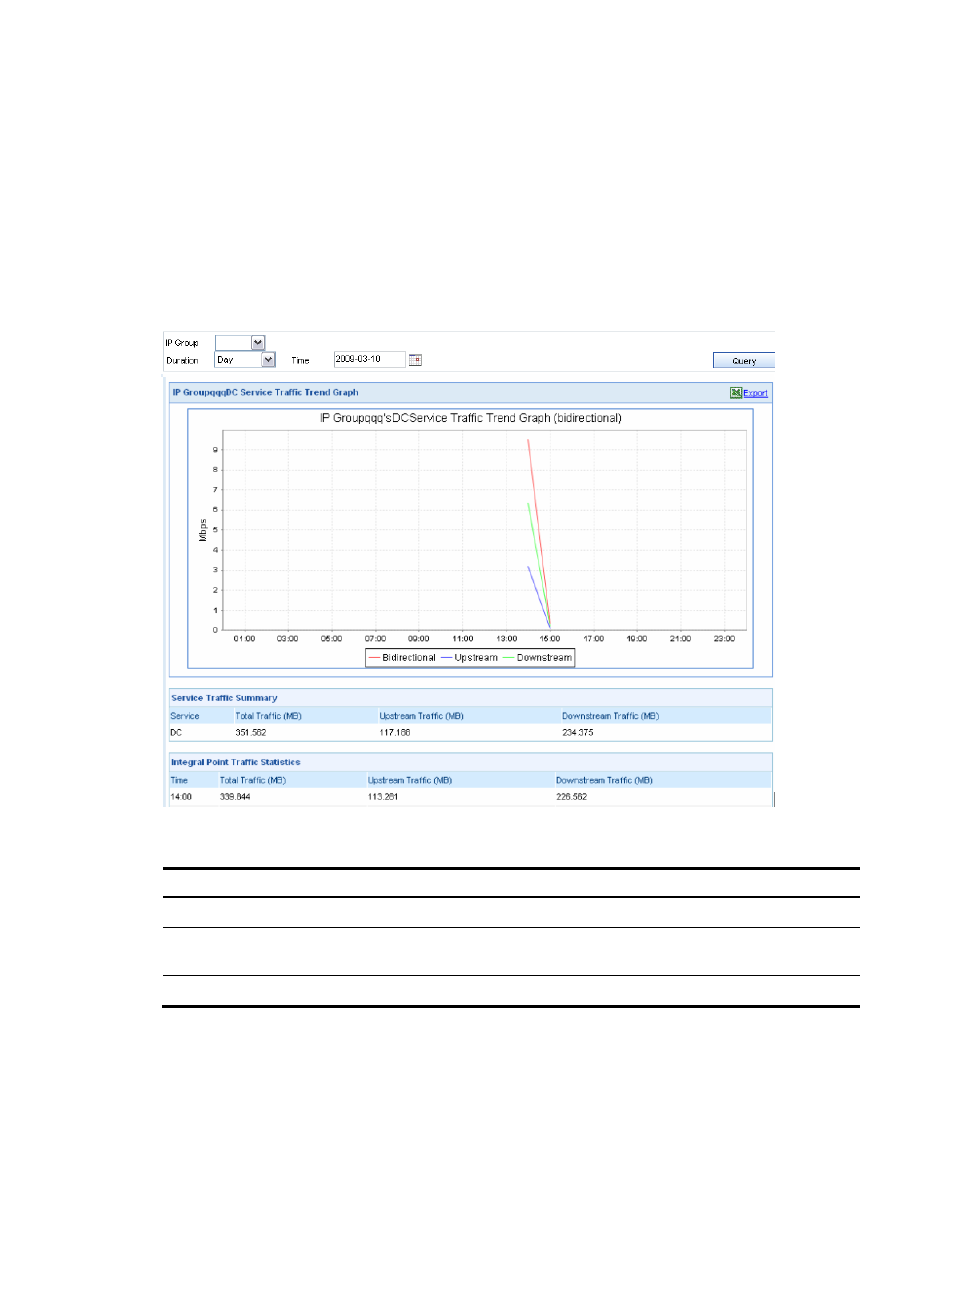
Traffic statistics of a specific service for an IP group
The traffic statistics report of a specific service for an IP group is also divided into three areas:
•
The upper area displays traffic trend graph of a specific service, showing the trends for the upstream,
downstream, and streams of both directions in a line chart.
•
The middle area lists the traffic summary of the service.
•
The lower area lists the integral point traffic statistics of the service.
describes the service traffic trend query options on the traffic trend report page for an IP group.
Figure 79 Traffic statistics of a specific service for an IP group
Table 74 Service traffic trend query options on the traffic trend repot page for an IP group
Option Description
IP Group
Select an IP group
Duration
Select the statistics duration. You can select Day, Week, or Month, or select Customize
to specify a statistics duration.
Time
Select the statistics time. The value range varies with the statistics duration selected.
Service traffic distribution of an IP group
This function collects traffic statistics of an IP group, and displays distribution graphs of different levels.
From the navigation tree of the bandwidth management component, select Service Traffic Distribution
under Analysis by IP Group to enter the level-1 service traffic distribution report page, as shown in
. On this page, you can do the following: