Wavetronix Command DataView (CMD-DV) - User Guide User Manual
Page 53

52
CHAPTER 5 • WORKBOOKS PAGE
˽
VSO Graph – Displays a line showing the flow of data from the beginning to the end of
the day for volume, speed and occupancy; the three data lines can be toggled by check-
ing the V, S and O boxes. If the data comparison feature is turned on, the graph will
also display up to three comparison lines—labeled CV, CS and CO—allowing direct
comparisons between the data.
˽
Show Flagged Data Only – Filters the Data List to show only those data entries that
have been previously flagged by one or more filters.
˽
Show Missing Data – Determines whether missing data records are to be displayed in
the list (displayed with blank data values).
˽
Show Suggested Values – Determines whether suggested values (either from filters or
from comparable data) are to be displayed in the list.
˽
Display Settings – Controls the number of data records displayed on the page, defined
in hours. If the Data Per Page value is set to be less than 24 hours, the page control will
become visible at the bottom of the page, allowing you to switch between pages.
˽
Choose A Date – Allows you to select the day to be displayed in the Data List using the
calendar pop-up.
˽
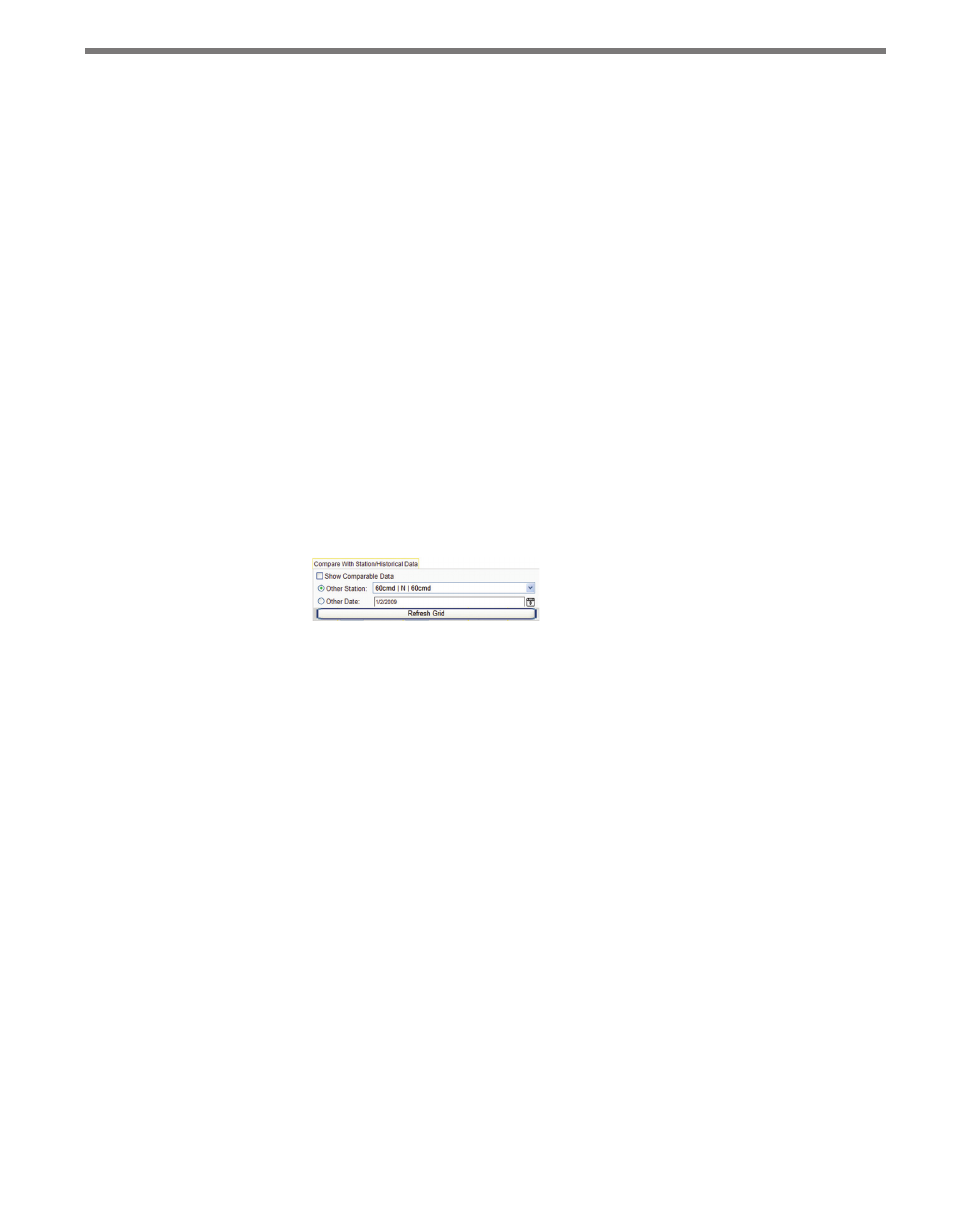
Compare With Station/Historical Data – Allows daily data for a station to be directly
compared with data from either another day or another station, showing any data dif-
ferences.
Figure 5.9 – Compare With Station/Historical Data
To use this option, check the Show Comparable Data checkbox, then select one of the
two compare options: Other Station, which compares data for the same day but from
another station in the workbook, or Other Date, which compares data from the same
station but from another day in the workbook.
Once set, click Refresh List to open the comparable data in the list. If data exists for
the given station/date, the comparable data values will be displayed in the Suggestion
columns to the right of each of the Volume, Speed and Occupancy columns. As with
data filter suggestions, these comparable data values can overwrite the current value
with the alternate value by clicking on the link.
˽
Data List – Displays current-day data records for the station. The data list displays one
full day at a time. Change the day by using the Previous Day and Next Day links or by
selecting a date from the Choose A Date calendar. Only dates within the scope of the
start/end dates for the current workbook can be chosen. Dates that contain at least one
flagged data record will be highlighted in red.
The list shows the time, volume, speed and occupancy of the traffic, as well as whether
the data was flagged and/or edited (see Figure 5.10).
