B1 – solution plot, Figure 29: b1 – solution plot, Tion plot (see figure 29 – NavCom StarUtil-2110 Rev.B User Manual
Page 38
StarUtil-2110 User Guide – Rev. B
B1 – Solution Plot
The B1 message must be scheduled for output for the solution plot to be active. If
the B1 message is not scheduled, select Receiver > Messages > NCT output
from the menu bar. The NCT Binary Messages window opens. Add message B1
to the output list (see Figure 19).
2
3
4
5
6
7 8
9
1
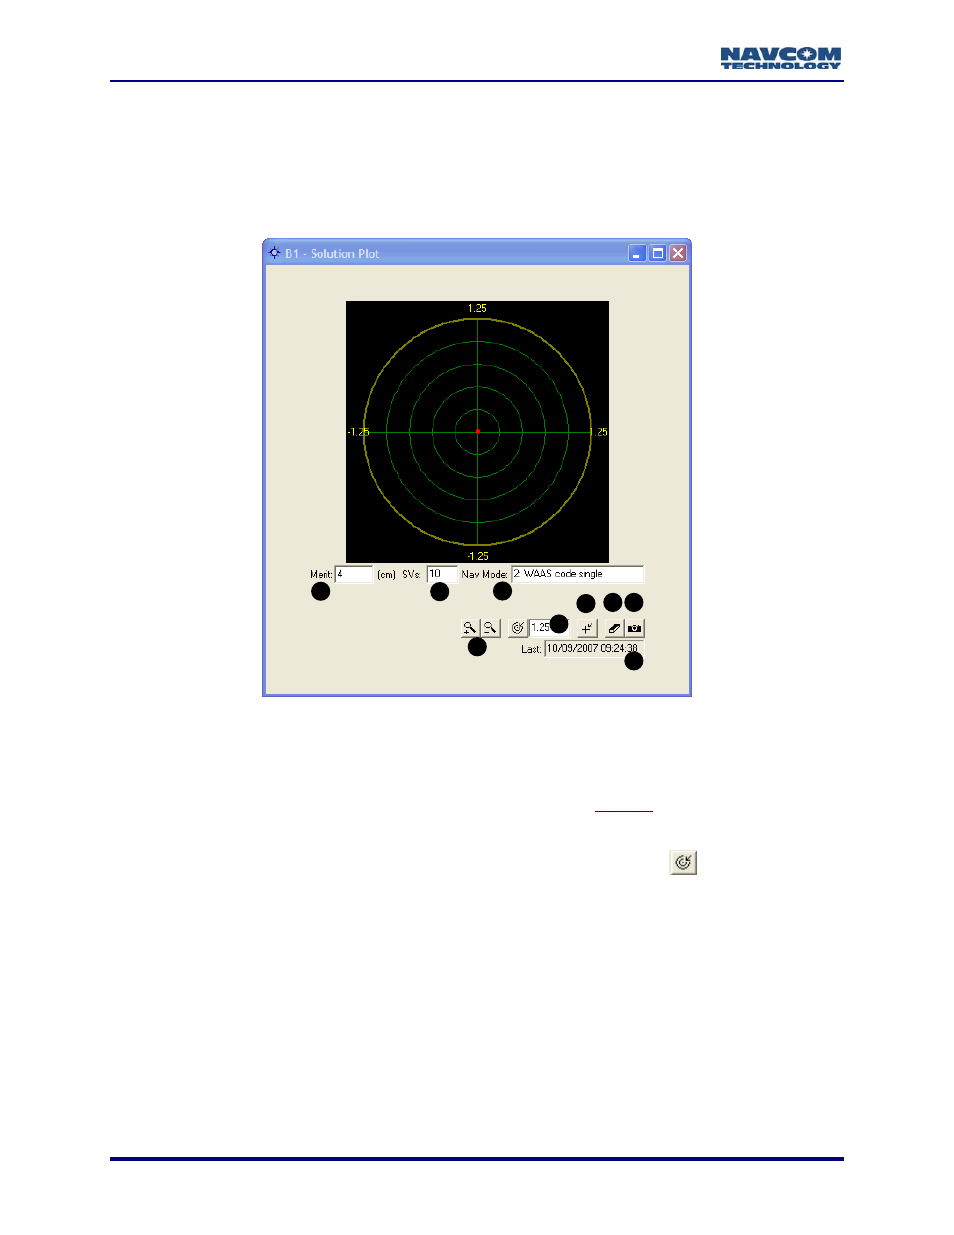
Figure 29: B1 – Solution Plot
1. Merit: The Figure Of Merit is the estimated uncertainty in the navigation solution.
2. SVs: The current number of satellite vehicles being tracked.
3. Nav Mode: The current navigation mode (see B1 – Solution,
4. Zoom in/ Zoom Out
5. Set scale: Enter a scale value in meters and click the Set scale button
. Each time the
plot is scaled, previously displayed plot points are erased.
6. Set origin: Click to set the origin source. The B1 – Plot Origin window opens (refer to the
instructions below).
7. Erase: Clear the plot.
8. Snapshot to paste buffer
9. Last: Shows the MM:DD:YYYY and HH:MM:SS of the last update of the plot.
4-36