Complex displays, Transfer type – Measurement Computing eZ-Record rev.2.1 User Manual
Page 39

39
January 2001
eZ-Record Manual
C
OMPLEX
D
ISPLAYS
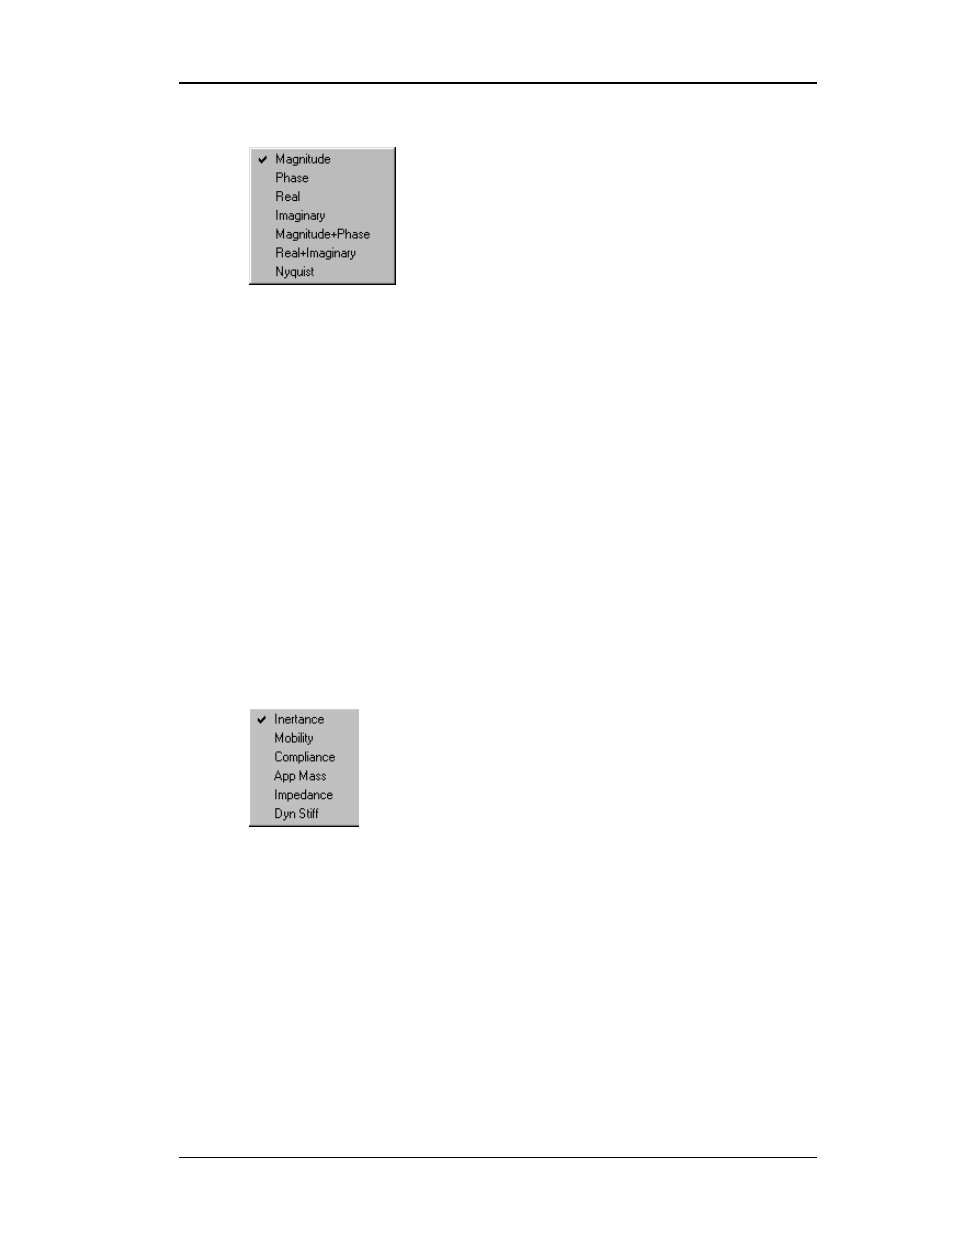
Open Complex Type Menu: Press “D” + “C” + “Enter”.
Use the down arrow key to highlight your selection and press “Enter”.
Options on the Complex Display menu are only available when a function
with complex data is displayed. The following options are available.
Magnitude: Plots only the magnitude of real or complex data.
Phase: Plots only the phase of complex data.
Real: Plots only the Real numbered data.
Imaginary: Plots only the imaginary numbered data.
Magnitude + Phase: Plots both Magnitude and Phase data.
Real + Imaginary: Plots both Real and Imaginarily data.
Nyquist: A Nyquist plot is another way to display real and imaginary data.
The real numbered data is plotted on the X-axis and the imaginary numbered
data is plotted on the Y-axis with consecutive points joined by line segments.
From basic vibration theory, a Nyquist plot of a mobility function should
trace out a circle (counter-clockwise) as the frequency is increased through
an isolated structural resonance.
T
RANSFER
T
YPE
Open Transfer Type Menu: Press “D” + “T”.
Use the down arrow key to highlight your selection and press “Enter”.
These functions are calculated by dividing the cross spectrum of the channel
pair by the auto spectrum of the reference (force) channel.
·
Inertance (acceleration/force)
·
Mobility (velocity/force)
·
Receptance or Compliance (displacement/force)
These reciprocal functions are derived from the first three by taking the
inverse of the magnitude reflecting the phase about the zero degree line (-1*
phase angle).
·
Apparent Mass (force/acceleration)
·
Impedance (force/velocity)
·
Dynamic Stiffness (force/displacement)
