K-Patents PR-01-S User Manual
Page 61
INSTRUCTION MANUAL FOR K-PATENTS PR-01-S (-AX/FM/CS)
DOCUMENT/REVISION No. INM 1/14
Effective: May 15, 2009
59
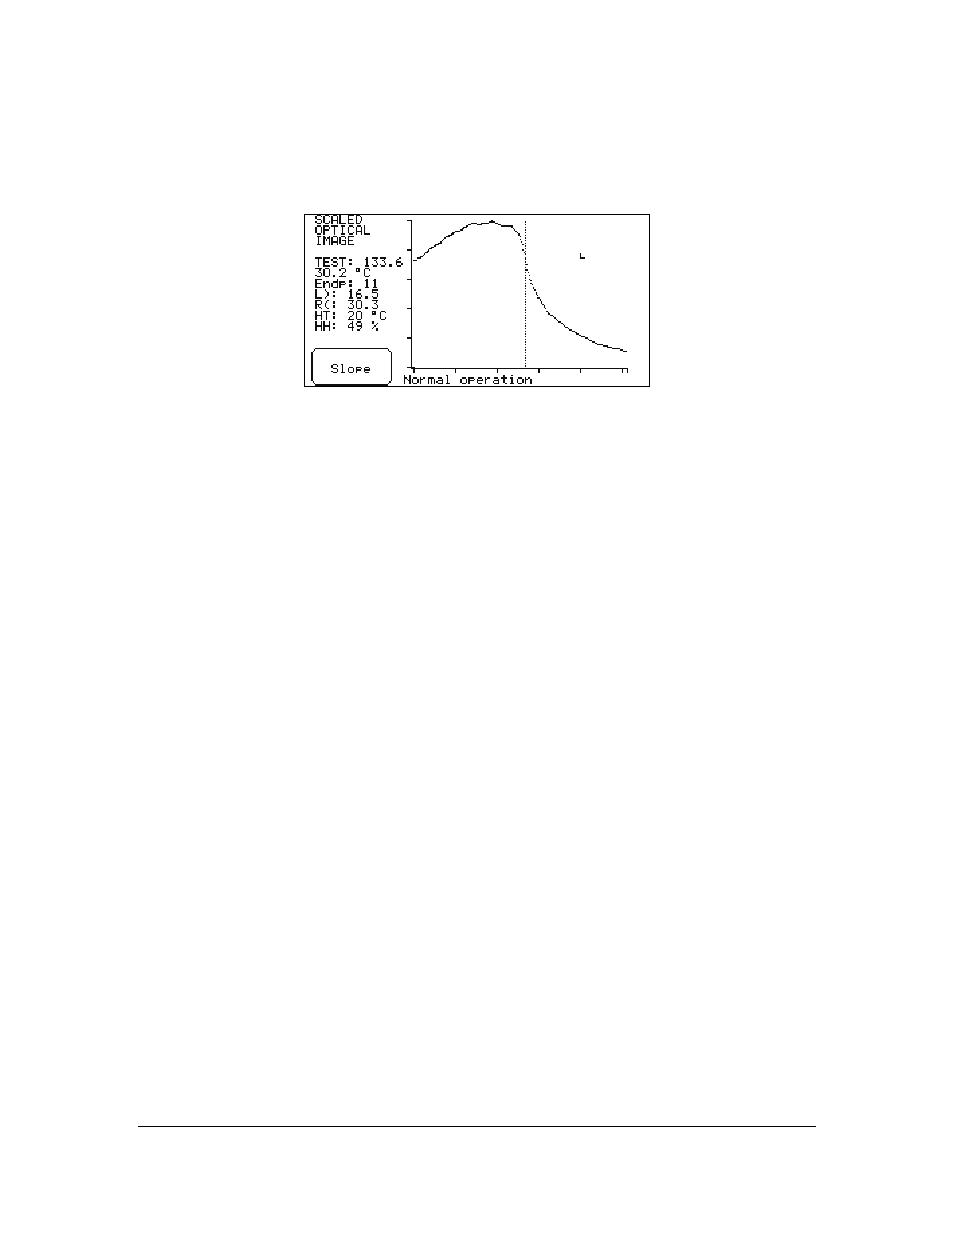
Scaled image:
The following display is the scaled image, Figure 6.53. The optical image is now modified mathematically.
The following information is provided (where the numbers refer to Figure 6.53):
Figure 6.53
Scaled optical image.
1.
TEST:
The calculated TEST value, range 8...248. Indicated by a dotted vertical line.
T:
indicates the process temperature, to facilitate field calibration
2.
Endp:
the value of the rightmost point in % of span.
3.
L):
A measure of the left side curvature of the optical image.
4.
R(:
A measure of the right side curvature of the optical image.
A zero curvature indicates a straight line. Both curvature values are defined as positive
for an image as Figure 6.53.
5.
HT:
Sensor head internal temperature in °C.
6.
HH:
Sensor head internal relative humidity in %RH.
7.
An L-shaped corner mark. For a clean prism in air the optical image should form a
smooth hill and be above the corner mark.
Slope:
This display shows the slope curve of the optical image. At the TEST value, the SLOPE curve should have
a sharp dip. The following additional values are given:
Max:
The filtered value of the maximum light intensity RMX of the raw data
(Figure 6.51).
Slope:
The absolute value of the slope curve dip at TEST. The value of Slope
must be above 1 to be acceptable.
Image diagnostics:
This display lists the critical values for TEST acceptance according to the image analyzer decision rules in
Figure 6.54.
Max intensity OK (above 100)?
Yes/No
Endpoint below 75 %?
Yes/No
Image below corner?
Yes/No
Slope OK (above 1)?
Yes/No
Left curve OK (above 1)?
Yes/No
Right curve OK (above 1)?
Yes/No
For measurement with a normal sample, all answers should be "Yes".
A message "Dips in image" appears if the optical image is irregular.