Qos status monitor, Qos status monitor options, Figure 7-3 fx series qos status monitor screen – Comtech EF Data FX Series Administrator Guide User Manual
Page 108: 2 qos status monitor, 1 qos status monitor options pull downs, Display type, Reset button
Comtech EF Data / Stampede
FX Series Administration Guide - Version 6.1.1
108
Chapter: FX Series Status
Section: QOS Status Monitor
MN-FXSERIESADM6 Rev 5
7.2
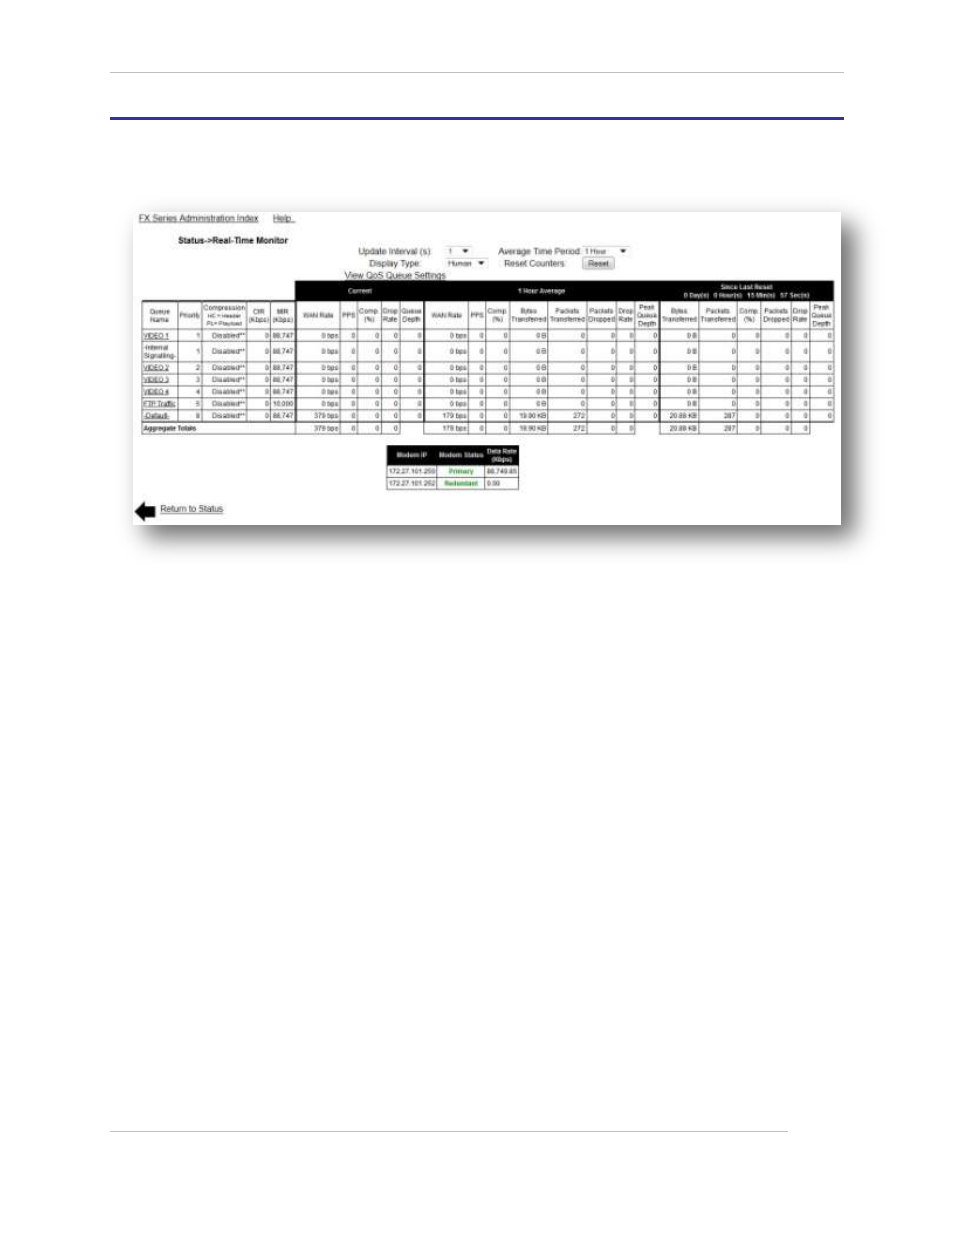
QOS Status Monitor
The QOS Status Monitor provides a real time view of vital QoS statistics, including current, average and
elapsed stats. All elapsed and average stats begin with the last Reset of the screen.
Figure 7-3 FX Series QOS Status Monitor Screen
7.2.1 QOS Status Monitor Options
Pull Downs:
Current Update Interval:
This determines the rate at which the screen is updated. There are selectable rates from 1 to 60
seconds.
Average Time Period:
This selects the time for which stats are averaged in the associated field. Options are 1, 24 and
72 hours.
Display Type:
Raw is the just that, the raw number. Human readable uses metric conventions. All data rate
numbers will be given as powers of 10. In this case, k = 10
3
, M – 10
6
, G = 10
9
, and T = 10
12
. This
refers to both data rate and total number of packets sent.
When referring to the number of bytes sent, the convention is powers of 2. In this case, k = 2
10
,
M = 2
20
, G = 2
30
and T = 2
40
.
Reset Button:
This resets the inception time to the current time.