Xtramus NuTAP-S61 V1.2 User Manual
Page 69
69
Report Control Buttons Descriptions
The
counter reports
to Microsof
Save button allows you to save the current Network Port and Monitor Port
t Excel ® format files.
The Up
Main Display
Window
date button allows you to start/stop updating statistics displayed in the
.
The Clear
y Window.
button allows you to clear all statistics displayed in the Main Displa
The Hide
x statistics, as well
as fold all tr
button allows you to hide all Network Ports and Monitor Ports’ TX/R
ee style tab statistics in the Main Display Window.
The
Rx statistics, as
Show button allows you to show all Network Ports and Monitor Ports’ TX/
well as unfold all tree style tab statistics in the Main Display Window.
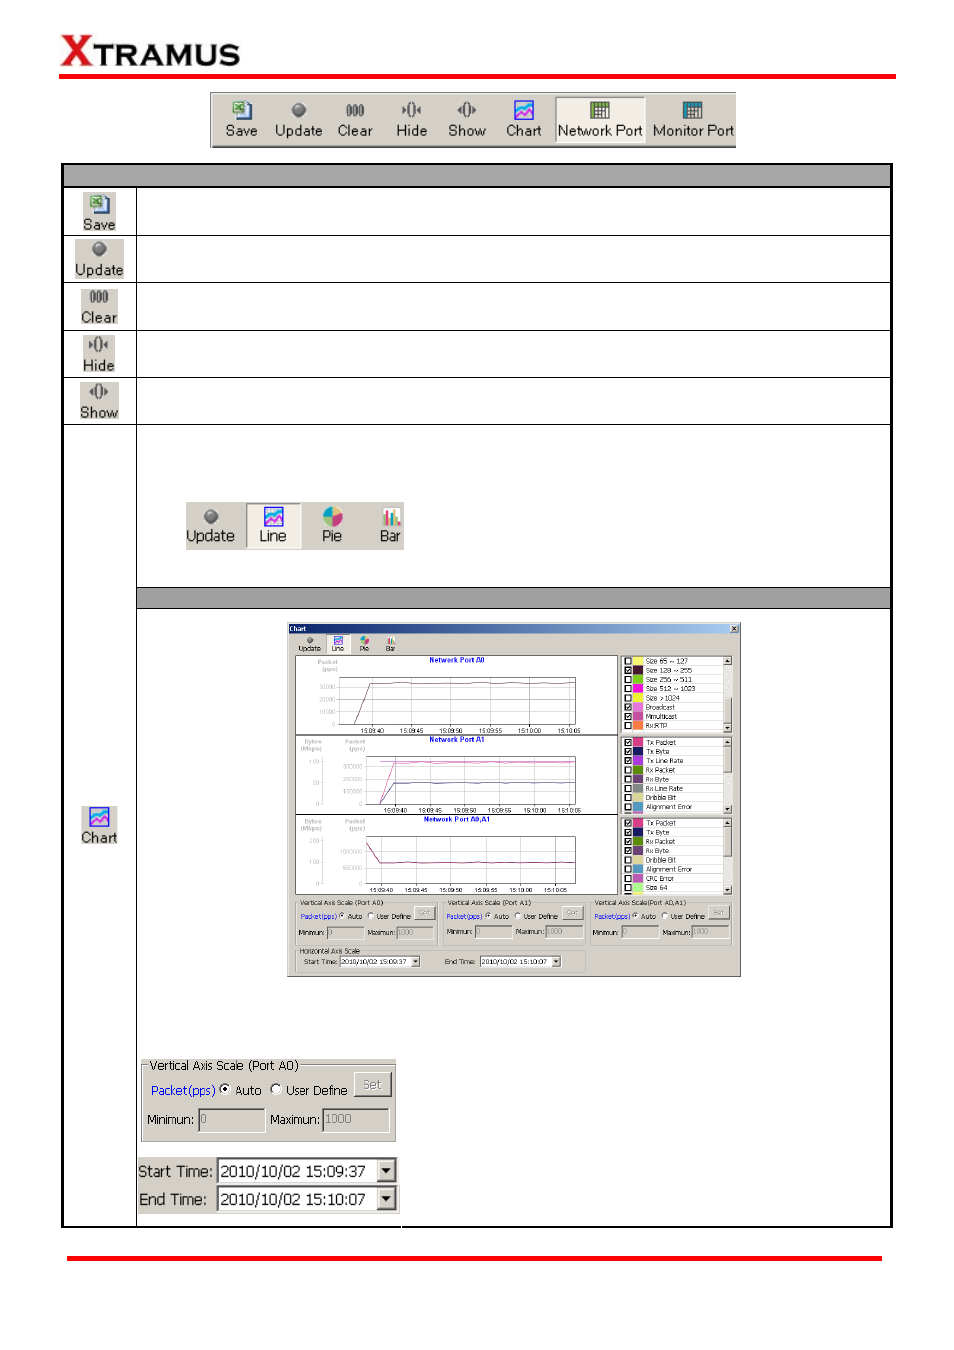
The
on a pop-up Chart
window
, Pie, and Bar.
Chart button allows you to view Network Port’s Counter Report Chart
. There are three different display modes for Counter Report Chart: Line
¾ Update: Start/Stop updating Counter Report
Chart.
¾ Line: Switch the chart di
Mode.
¾ Pie: Switch the chart display mode t
splay mode to Line
o Pie Mode.
¾ Bar: Switch the chart display mode to Bar Mode.
Line Mode
XTRAMUS TECHNOLOGIES
®
The Line Mode displays the statistics about the of packets flow through Network Port A0,
Network Port A1, and Network Port A0/A1. To display the statistics as line on the chart, please
click the check box of that statistics.
The Vertical Axis Scale fields allow you to set the scale in
pps (Packets per Second) of the X-Axis of the Line Chart.
The Vertical Axis Scale can be set to Auto, or you can set its
minimum/maximum value by User Define.
The Horizontal Axis Scale field allows you to set the scale of
the Y-Axis of the Line Chart. Click the scroll-down menus of
Start Time and End Time to set the statistics during a period
of time.
E-mail: [email protected]
Website: www.Xtramus.com