Appendix c, Automatic statistical calculations – Parr Instrument 6200 User Manual
Page 69
70
6200
Calorimeter Operating Instruction Manual
The 6200 Calorimeter includes a provision
for calculating and using a mean energy
equivalent for each of up to 4 separate bomb
and bucket combinations. ASTM procedures
recommend that the energy equivalent be
determined by averaging ten tests. The 6200
Calorimeter automatically determines and
uses up to 10 tests in its memory and will
update the EE Value as additional
standardizations are run. Only Final Tests will
be used in determining and updating EE
values. These values, the number of tests,
and the relative standard deviation for the
tests used in determining the EE value are
stored in the Calibration Data Page under the
EE Value for each bomb.
The user can chose to turn off the
automatic averaging and updating procedure
and protect the EE Values by turning ON the
protection feature for the appropriate bomb on
the Calibration Data and Control Page using
Protected EE Value.
Any outliers or other tests which
should not be included in the average
EE Value must be deleted from the
memory using the memory
management procedures (see Chapter 8).
A list of all tests associated with any Cal ID
can be printed from the Calibration Data
Page using Print Standardization Runs.
The user can elect to have any number
of stored standardization runs used in
determining the EE value by entering this
number on Calibration Data & Controls
Page - Calibration Run Limit.
EE Max Std Deviation on this same
page establishes the maximum allowable
standard deviation for the EE Value before
an error condition is reported. The default
value is zero which turns off this limit. But
the user should enter a value appropriate
for the test being made.
Automatic
Statistical
Calculations
APPENDIX C
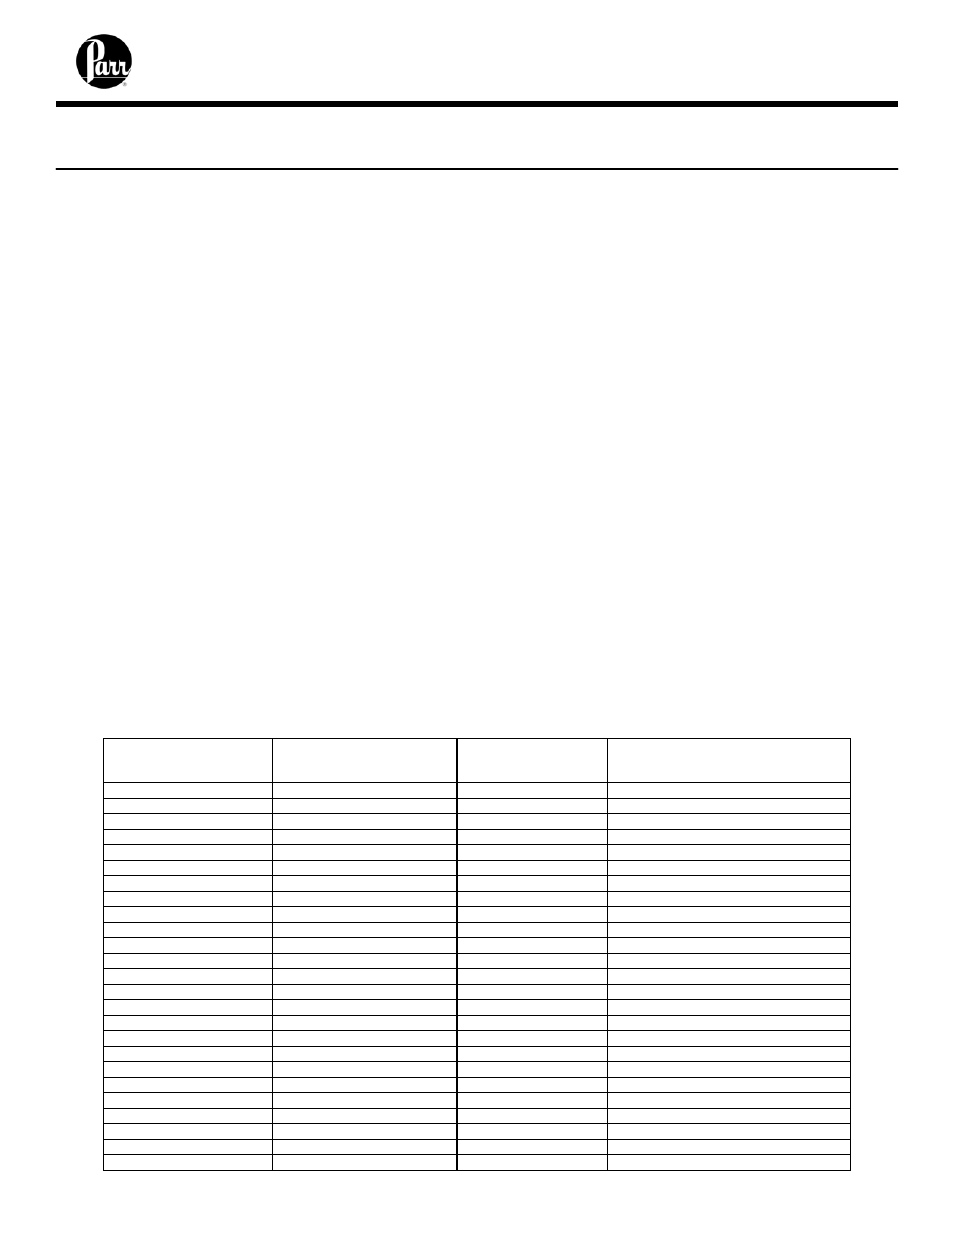
Calorimeter control limits when benzoic acid is used as a test sample
Accepted heat of combustion taken as 26454 J/g.
Instrument precision 0.10% RSD.
Control limits based on 99% confidence (3 sigma) values. Values are in J/g.
NUMBER OF
OBSERVATIONS IN A
GROUP
UCL FOR THE RANGE
(HIGH – LOW) WITHIN THE
GROUP
UCL FOR THE RSD
WITHIN THE GROUP
MAXIMUM PERMISSIBLE DEVIATION
OF THE GROUP MEAN FROM THE
ACCEPTED VALUE OR GRAND MEAN
1
79.4
2 97.5
0.2606 56.1
3 115.3
0.2276 45.8
4 124.3
0.2088 39.7
5 130.1
0.1964 35.5
6 134.3
0.1874 32.4
7 137.6
0.1806 30.0
8 140.4
0.1751 28.1
9 142.7
0.1707 26.5
10 144.7
0.1669 25.1
11 146.4
0.1637 23.9
12 147.9
0.1610 22.9
13 149.4
0.1585 22.0
14 150.7
0.1563 21.2
15 151.8
0.1544 20.5
16 153.0
0.1526 19.8
17 154.0
0.1511 19.2
18 154.9
0.1496 18.7
19 155.8
0.1483 18.2
20 156.7
0.1470 17.7
21 157.4
0.1459 17.3
22 158.2
0.1488 16.9
23 158.9
0.1438 16.5
24 159.5
0.1429 16.2
25 160.2
0.1420 15.9