I. introduction – Brookfield YR-1 Rheometer User Manual
Page 5
Brookfield Engineering Labs., Inc.
Page 5
Manual No. M02-215-B0412
I.
INTRODUCTION
The yield point is the point at which a material begins to flow. The associated properties are the
yield stress and yield strain. The yield stress is the critical shear stress, applied to the sample,
at which the material begins to flow as a liquid. The yield strain is the deformation, resulting
from the applied stress, at which the flow starts.
Many materials are designed to have a yield point, so that the behavior of their products satis-
fies various customer needs. Foods often have yield points. Ketchup, in particular, must flow
out of a bottle when shaken or squeezed, but then solidify on the targeted food, such as french
fries. Shaking or squeezing the bottle stresses the ketchup so that it flows; after the ketchup
settles on the fries, its structure rebuilds so the ketchup “sits” in place rather than flowing off
the fries like water. Puddings have yield points, as well. The “body” of the pudding appeals
to consumers – it is solid at rest, yet it’s easily spooned out of its cup and is easy to eat. Thus,
the yield behavior of many foods contributes to the food texture that we like.
Many paints have low yield stresses. Many latex house paints, for example, are easily stirred or
poured. Brushing or spraying provides enough stress so that the paint flows easily and smoothly
over a painted wall. However, a thin layer of applied paint that is allowed to rest undisturbed
on the surface, regains its structure quickly so that there is very little unsightly “dripping” af-
terwards. The smooth appearance of the painted surface is very appealing to the homeowner.
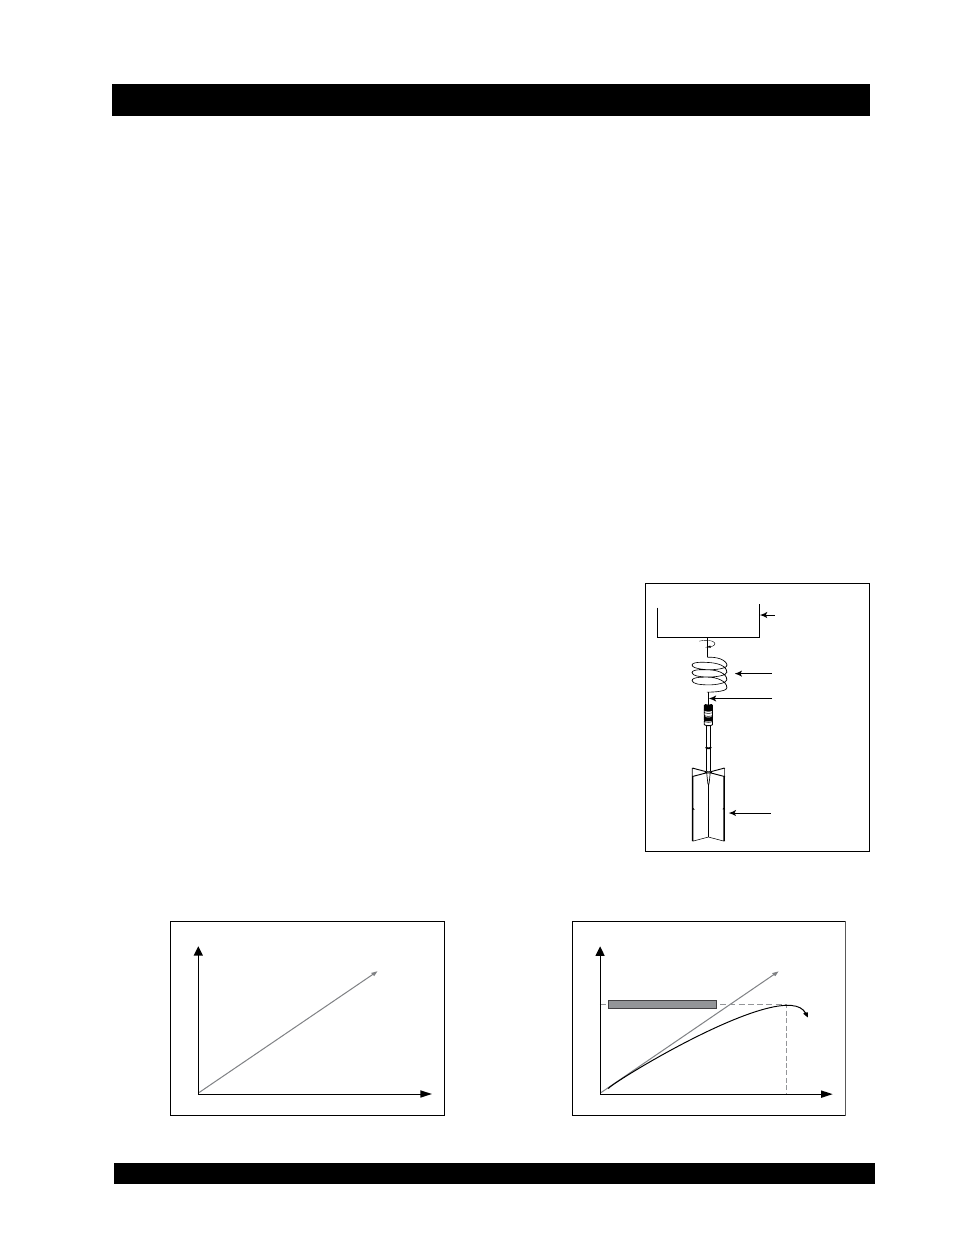
The operating principle of the YR-1 Rheometer is to drive a
spindle through a calibrated spiral spring connected to a motor
drive shaft (see Figure I-1). The vaned spindle is immersed in
the test material. The resistance of the material to movement
is measured by observing increasing torque values as the YR-1
motor rotates. The amount of shaft rotation is measured by the
deflection of the calibrated spiral spring inside the instrument.
Spring deflection is measured with a rotary transducer.
If the vane spindle did not move at all, the data would look like
the graph in Figure I-2. The data often looks like the graph in
Figure I-3 because there usually is some deformation of the
test material due to the increasing force imparted by the vane
TIME
TORQUE
Figure I-2
Motor
Calibrated
Spiral Spring
Drive
Shaft
Vane
Spindle
Figure I-1
Maximum Torque Value
TIME
TORQUE
Figure I-3