Sleeping period, Working with the rise and fall view, 10 zoom in on a graph – Welch Allyn CardioPerfect Workstation ABP Module - User Manual User Manual
Page 25: To zoom in on a graph, To reset the zoom, 11 exceeding norms view, Cardioperfect workstation, Abp module - user manual
CardioPerfect Workstation
ABP Module - User Manual
DIR 80012332 Ver. E
25 / 40
The lower chart displays:
A first derivation of the filtered MAP curve. This derivation clearly displays the
rise and fall of the blood pressure.
Sleeping period
The measurements that were recorded during the sleeping period are displayed in
the grayed area.
Working with the Rise and fall view
In the Rise and fall view, you can:
Zoom in on a graph (see §3.10 ).
3.10 Zoom in on a graph
In the Trends view, the Scatter points view and the Rise and fall view, you can zoom in
on a part of the graph.
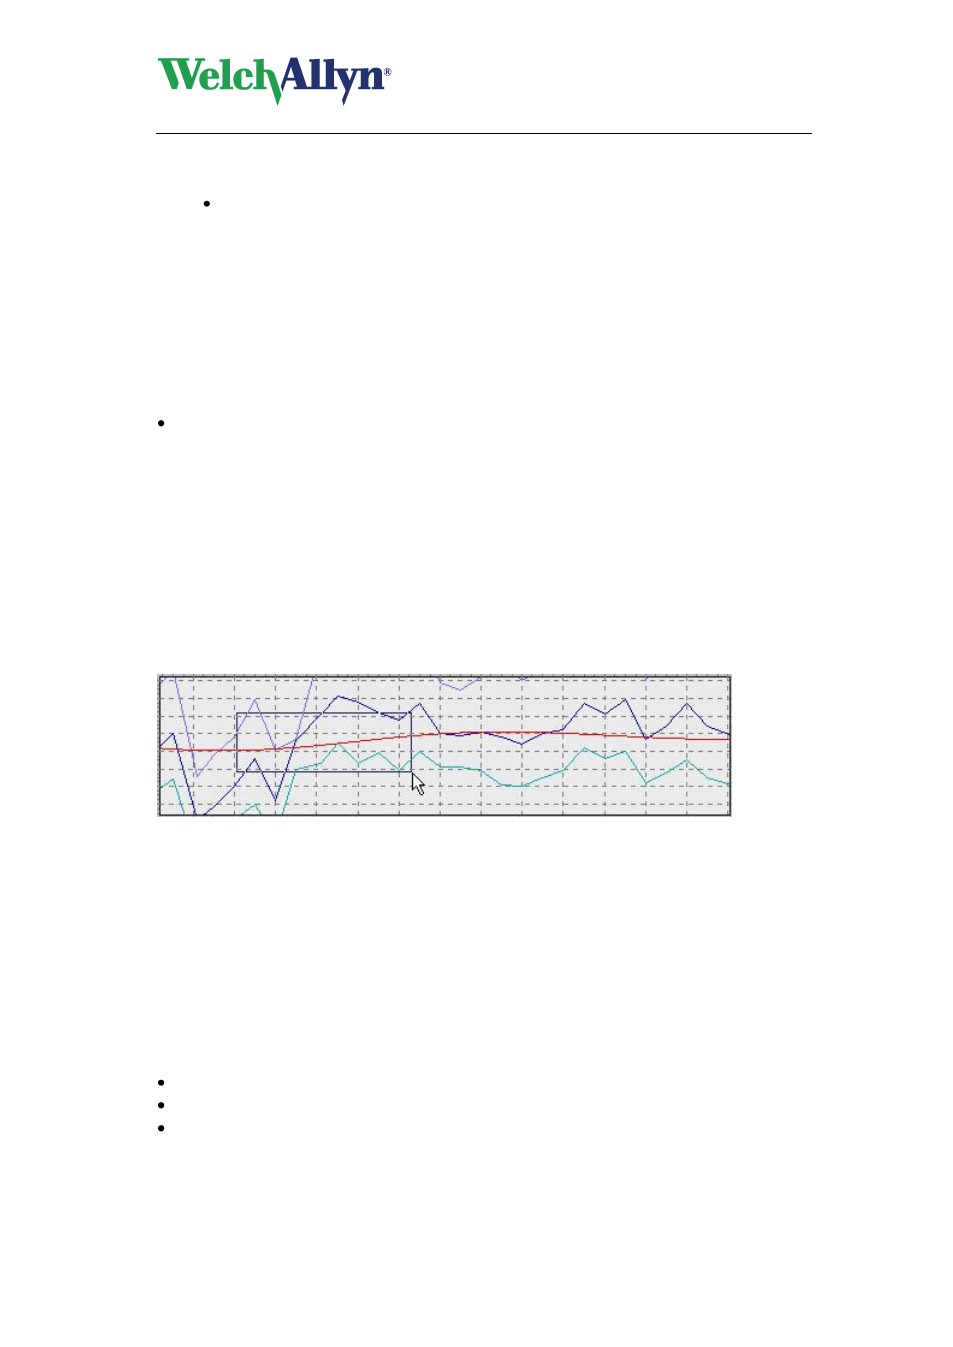
To zoom in on a graph:
1. Position your mouse near the area that you want to enlarge.
2. Click your mouse button and keep it pressed. When you move the mouse from the
top left corner to the bottom right corner of the graph, a square is drawn.
3. Drag the square over the area that you want to enlarge. The area is enlarged.
To reset the zoom:
1. Right click on the graph.
2. In the shortcut menu, click Reset zoom. The graph is restored to its original size.
3.11 Exceeding norms view
The Exceeding norms view displays the percentages of measurements that are
Normal (less or equal than the norm value)
Acceptable (range [100
– 125] % of the norm value)
Critical (greater than 125% of the norm value)
See paragraph 6.2
„ABP settings- General tab‟ on page 30 for the norm value.
The percentages are displayed in pie charts, both for systolic and diastolic pressure.