Sleeping period, Working with the scatter points view, Toggle between one or all graphs – Welch Allyn CardioPerfect Workstation ABP Module - User Manual User Manual
Page 24: 9 rise and fall view, Information, Cardioperfect workstation, Abp module - user manual
CardioPerfect Workstation
ABP Module - User Manual
DIR 80012332 Ver. E
24 / 40
Sleeping period
Each correlation graph can be displayed for all measurements, measurements for the
sleeping period or measurements for the awake period.
Working with the Scatter points view
In the Scatter points view, you can:
Toggle between one graph or all graphs.
Zoom in on a graph (see §3.10 ).
Toggle between one or all graphs
In the Scatter point view, the default view displays all four scatter point graphs. You can
display each graph individually by clicking the graph names at the top of the Scatter point
view.
You can also select whether you want to see the overall measurements, measurements for
the sleeping period or measurements for the waking period.
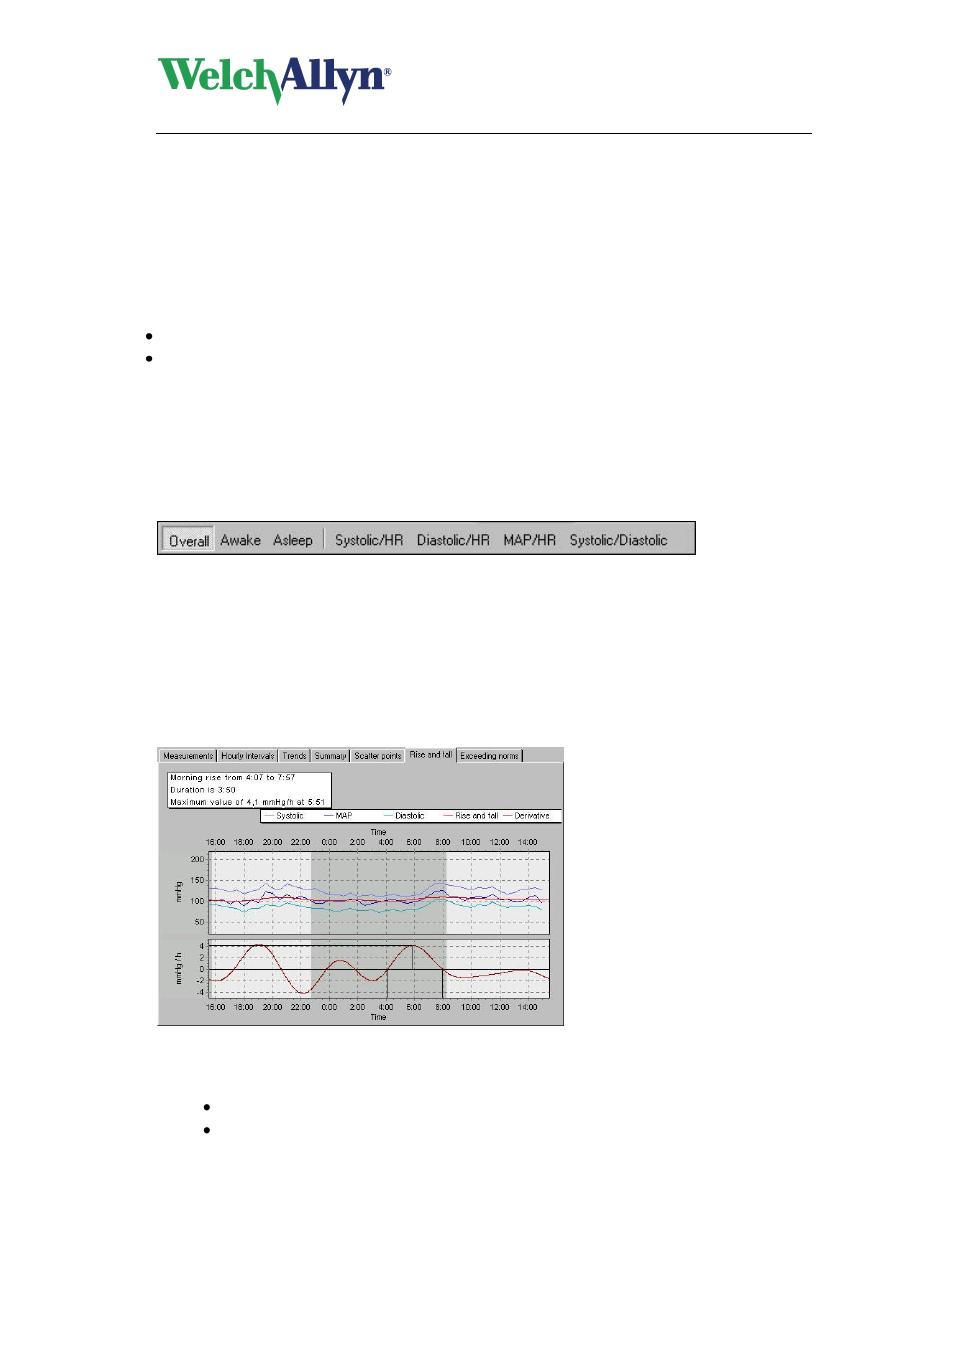
3.9 Rise and fall view
The Rise and fall view displays values for the rise and fall of the blood pressure during the
test.
Information
The upper chart displays:
The diastolic and systolic pressure and MAP values.
A rise and fall curve. This curve is obtained by filtering the MAP curve.
- GS 777 Wall Transformer - User Manual (1 page)
- 7114x Desk Charger - User Manual (8 pages)
- Mounting Bracket Replacement Kit for 7670-12 Mobile Stand with Mounting for 767XX and 777XX - User Manual (2 pages)
- 767 Diagnostic System - User Manual (16 pages)
- 767 Diagnostic System - User Manual (136 pages)
- 118 Series PanOptic Ophthalmoscope - User Manual (26 pages)
- 118 Series PanOptic Ophthalmoscope - User Manual (28 pages)
- VS100 Welch Allyn Vision Screener - User Manual (34 pages)
- SureSight Vision Screener - User Manual (36 pages)
- SureSight Vision Screener - User Manual (32 pages)
- Connex Integrated Wall System - User Manual (161 pages)
- SureSight Autorefractor - User Manual (36 pages)
- 12500 Binocular Indirect Ophthalmoscope Power Source - User Manual (12 pages)
- TM286 Auto Tymp - User Manual (72 pages)
- TM 262 Auto Tymp - User Manual (92 pages)
- MicroTymp 3 portable tympanometric instrument - User Manual (76 pages)
- Audioscope 3 Portable Screening Audiometer - User Manual (32 pages)
- AM282 Audiometer - User Manual (32 pages)
- AM 232 Manual Audiometer - User Manual (38 pages)
- Digital MacroView Otoscope - User Manual (32 pages)
- Digital MacroView Otoscope - User Manual (476 pages)
- OAE Hearing Screener - User Manual (62 pages)
- OAE Hearing Screener - User Manual (56 pages)
- OAE Data Manager - User Manual (39 pages)
- Ear Wash System 29350 - User Manual (28 pages)
- Standard laryngoscope blade assemblies - User Manual (6 pages)
- Standard laryngoscope handles - User Manual (6 pages)
- Rechargeable laryngoscope handles - User Manual (8 pages)
- Fiber optic laryngoscope handles - User Manual (7 pages)
- Fiber optic laryngoscope blade assemblies - User Manual (6 pages)
- Original Harvey and Harvey DLX Double and Triple Head Stethoscopes - User Manual (28 pages)
- Harvey Elite Stethoscope - User Manual (2 pages)
- Professional Stethoscope - User Manual (2 pages)
- EXPENDABLE ILLUMINATOR - User Manual (2 pages)
- KleenSpec Single Use Vaginal Speculum - User Manual (2 pages)
- KleenSpec Vaginal Specula Illumination System - User Manual (20 pages)
- KleenSpec 790 Series Cordless Illumination System - User Manual (32 pages)
- KleenSpec 790 Series Cordless Illumination System - User Manual (222 pages)
- Video Colposcope - User Manual (48 pages)
- Video Colposcope - User Manual (400 pages)
- Rigid Reusable & Single use Sigmoidoscopes, Anoscopes, Accessories - Cleaning, Disinfection, and Sterilization - User Manual (12 pages)
- 6V Power Supply, Rectal Light Handle - User Manual (240 pages)
- Fl-100 Intubating Fiberscope - User Manual (32 pages)
- EpiScope Skin Surface Microscope - User Manual (2 pages)
- 719 Series Lithium Ion Handle - User Manual (2 pages)