Working with the summary view, Change the norm values, To change the norm values – Welch Allyn CardioPerfect Workstation ABP Module - User Manual User Manual
Page 23: 8 scatter points view, Information, Cardioperfect workstation, Abp module - user manual
CardioPerfect Workstation
ABP Module - User Manual
DIR 80012332 Ver. E
23 / 40
Working with the summary view
In the Summary view, you can:
Change the norm values for the systolic and diastolic blood pressure, and see how
many measurements are above the norm value.
Change the norm values
The Summary view displays how many measurements are greater than or equal to the
norm values. The norm values are set as a default in the ABP module. You can change the
norm values for one test.
To change the norm values:
In the Summary view, enter a new norm value in one of the norm value fields.
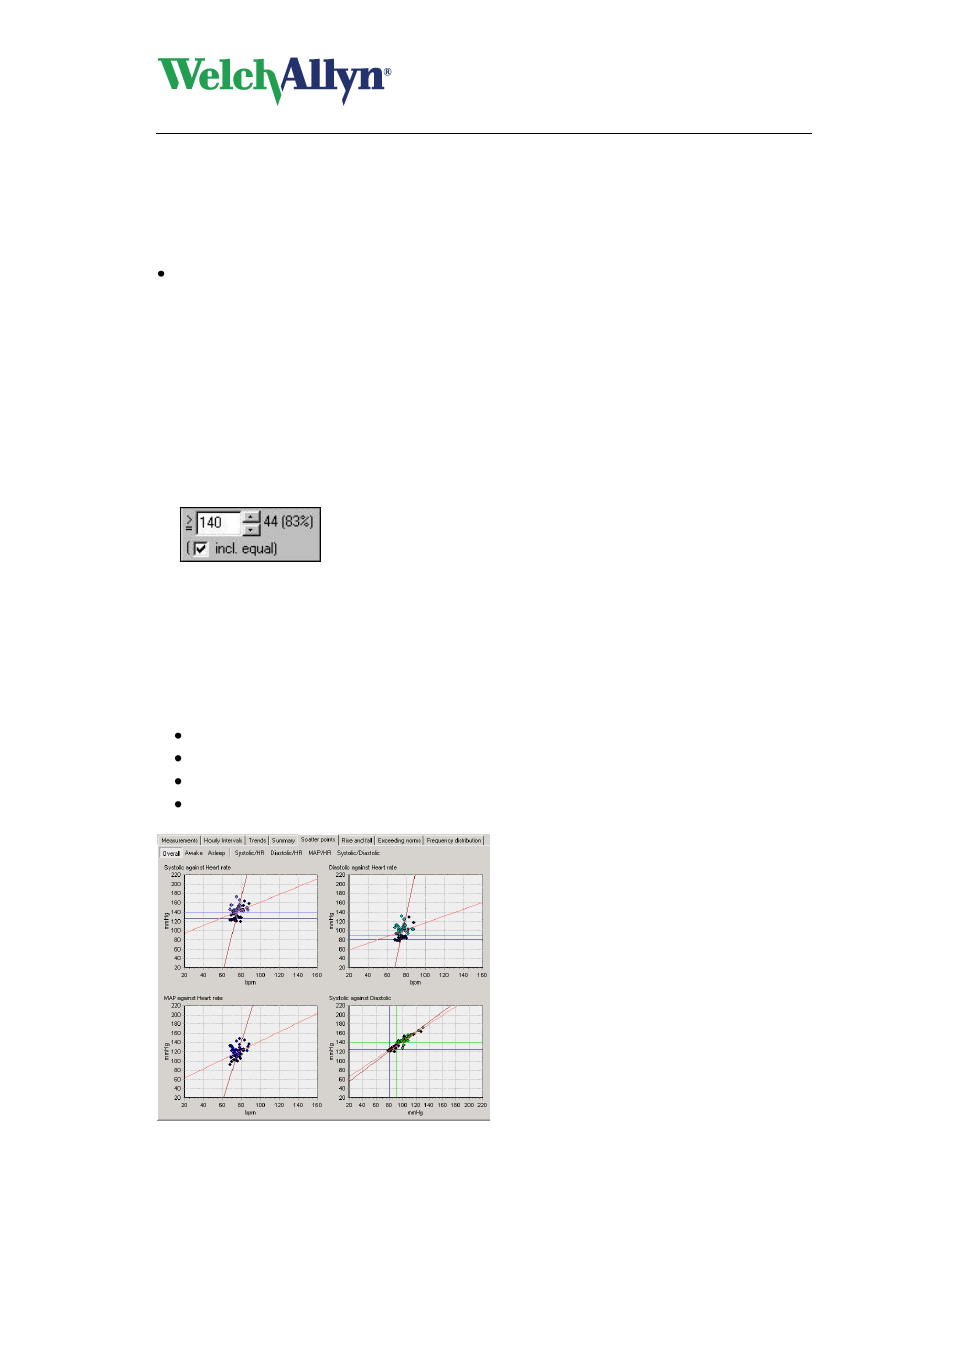
3.8 Scatter points view
A scatter plot reveals relationships or association between two variables. Such relationships
manifest themselves by any non-random structure in the plot.
The Scatter points view displays the correlation between the following values:
Systolic pressure against heart rate
Diastolic pressure against heart rate
MAP against heart rate
Systolic pressure against diastolic pressure
Information
One point on a graph represents one measurement. Black points were measured
during the sleeping period.