Graphical trends tab – Welch Allyn Connex Central Station - User Manual User Manual
Page 43
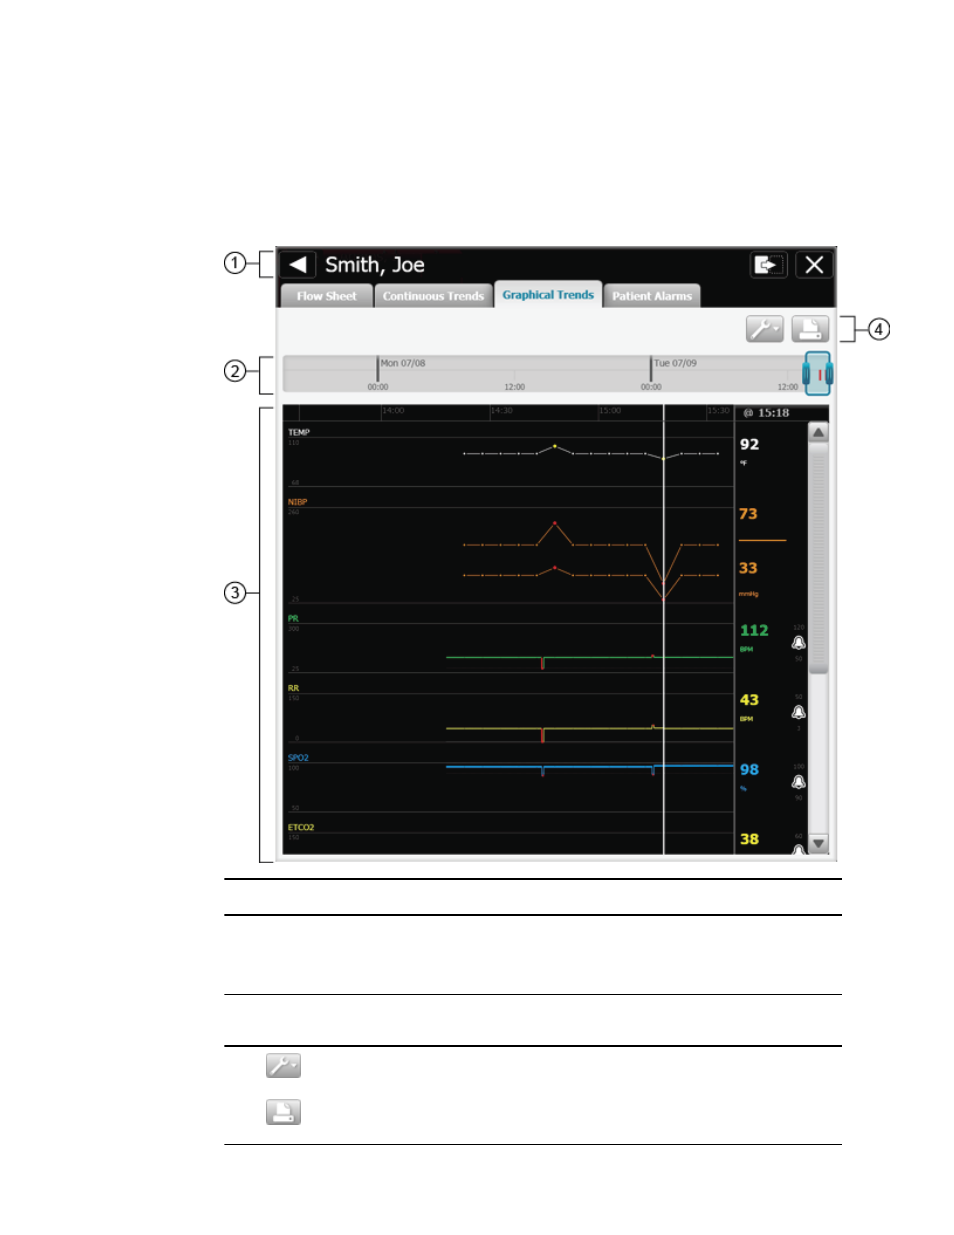
Graphical Trends tab
The Graphical Trends tab displays and graphically trends patient vital signs
measurements. Measurements are displayed by parameter in a row, and are updated in
a horizontal, side-scrolling format.
1. This area displays the patient summary.
2. This area allows you to change the duration of the displayed patient measurements and alarms.
Grab the center of the blue timeline bar and slide it left or right to select a different time interval. Grab and slide
either of the endpoints to widen or narrow the time interval.
3. This area displays the patient measurement trends in a graphical format. Alarms are displayed by an indicator at the
peak of the waveform.
4.
Click
to open the display options window. In this window, you can choose which vital signs are displayed and
whether or not manual parameters are displayed.
Click
to print the Graphical Trends.
Directions for use
Patient Review 37
- GS 777 Wall Transformer - User Manual (1 page)
- 7114x Desk Charger - User Manual (8 pages)
- Mounting Bracket Replacement Kit for 7670-12 Mobile Stand with Mounting for 767XX and 777XX - User Manual (2 pages)
- 767 Diagnostic System - User Manual (16 pages)
- 767 Diagnostic System - User Manual (136 pages)
- 118 Series PanOptic Ophthalmoscope - User Manual (28 pages)
- 118 Series PanOptic Ophthalmoscope - User Manual (26 pages)
- VS100 Welch Allyn Vision Screener - User Manual (34 pages)
- SureSight Vision Screener - User Manual (36 pages)
- SureSight Vision Screener - User Manual (32 pages)
- Connex Integrated Wall System - User Manual (161 pages)
- SureSight Autorefractor - User Manual (36 pages)
- 12500 Binocular Indirect Ophthalmoscope Power Source - User Manual (12 pages)
- TM286 Auto Tymp - User Manual (72 pages)
- TM 262 Auto Tymp - User Manual (92 pages)
- MicroTymp 3 portable tympanometric instrument - User Manual (76 pages)
- Audioscope 3 Portable Screening Audiometer - User Manual (32 pages)
- AM282 Audiometer - User Manual (32 pages)
- AM 232 Manual Audiometer - User Manual (38 pages)
- Digital MacroView Otoscope - User Manual (32 pages)
- Digital MacroView Otoscope - User Manual (476 pages)
- OAE Hearing Screener - User Manual (62 pages)
- OAE Hearing Screener - User Manual (56 pages)
- OAE Data Manager - User Manual (39 pages)
- Ear Wash System 29350 - User Manual (28 pages)
- Standard laryngoscope blade assemblies - User Manual (6 pages)
- Standard laryngoscope handles - User Manual (6 pages)
- Rechargeable laryngoscope handles - User Manual (8 pages)
- Fiber optic laryngoscope handles - User Manual (7 pages)
- Fiber optic laryngoscope blade assemblies - User Manual (6 pages)
- Original Harvey and Harvey DLX Double and Triple Head Stethoscopes - User Manual (28 pages)
- Harvey Elite Stethoscope - User Manual (2 pages)
- Professional Stethoscope - User Manual (2 pages)
- EXPENDABLE ILLUMINATOR - User Manual (2 pages)
- KleenSpec Single Use Vaginal Speculum - User Manual (2 pages)
- KleenSpec Vaginal Specula Illumination System - User Manual (20 pages)
- KleenSpec 790 Series Cordless Illumination System - User Manual (222 pages)
- KleenSpec 790 Series Cordless Illumination System - User Manual (32 pages)
- Video Colposcope - User Manual (48 pages)
- Video Colposcope - User Manual (400 pages)
- Rigid Reusable & Single use Sigmoidoscopes, Anoscopes, Accessories - Cleaning, Disinfection, and Sterilization - User Manual (12 pages)
- 6V Power Supply, Rectal Light Handle - User Manual (240 pages)
- Fl-100 Intubating Fiberscope - User Manual (32 pages)
- EpiScope Skin Surface Microscope - User Manual (2 pages)
- 719 Series Lithium Ion Handle - User Manual (2 pages)