Sirius weather, Weather forecasts – Mercedes-Benz C-Sedan 2015 COMAND Manual User Manual
Page 211
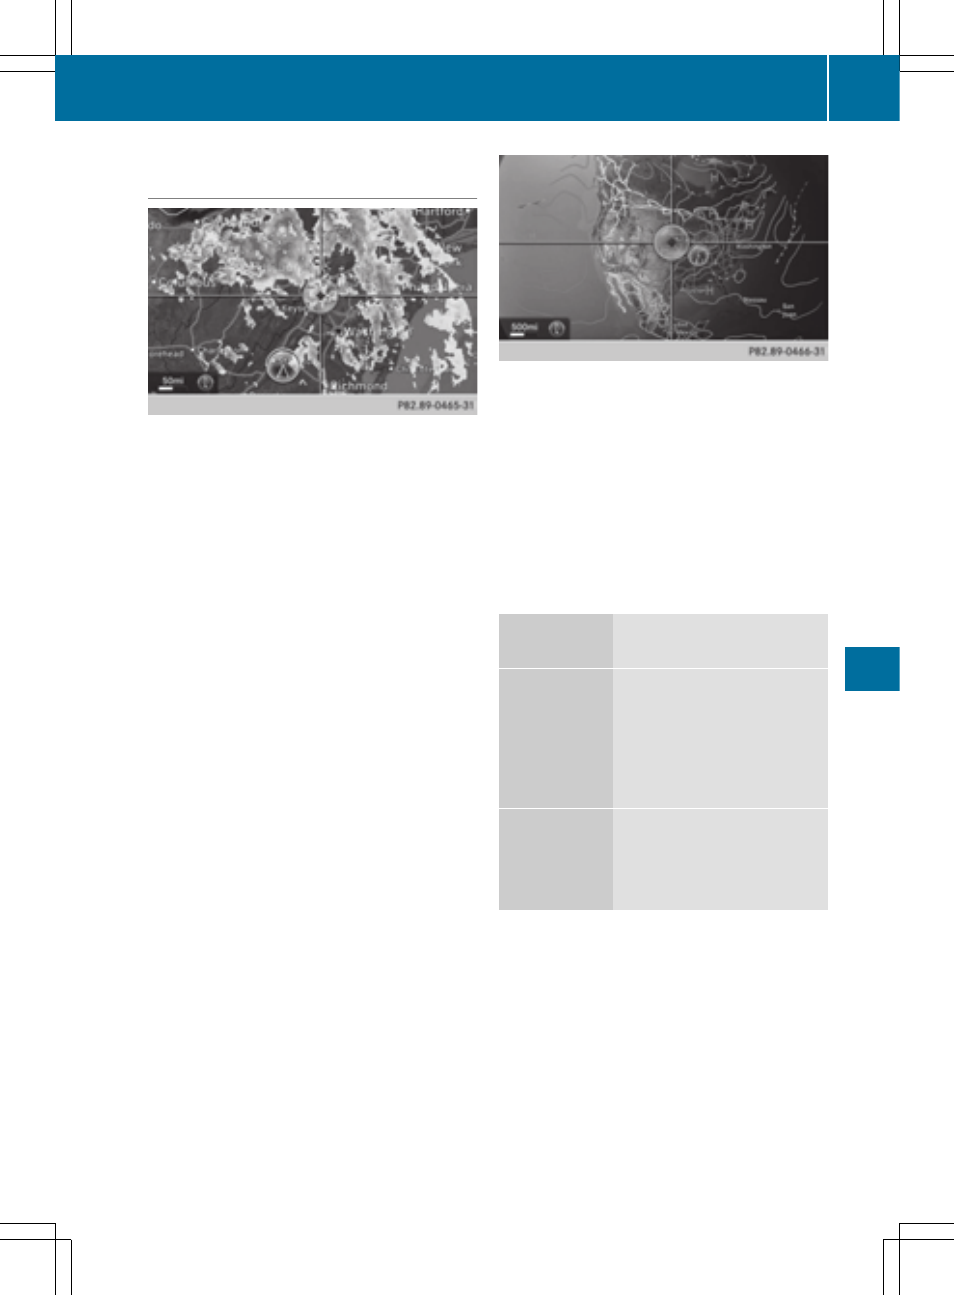
Sample displays of weather data in the
map
To display the rain radar:
X
Activate the
Radar Map
Radar Map
display level
(
Y
page 208).
The rain radar image is then displayed if
weather data is available.
i
You can call up the legend for the precip-
itation radar (
Y
page 211).
The transparency of the precipitation radar
map display level can be adjusted in five
stages.
To display storm characteristics:
X
Activate the
Storm
Storm Characteristics
Characteristics
dis-
play level (
Y
page 208).
If weather data is available, the weather
map will then display the storm character-
istics.
You can call up the legend for storms
(
Y
page 211).
The following information on a storm cell is
displayed (if available):
R
characteristics of the storm cell
R
date and time of observation (time
stamp)
R
directional movement speed and path
Propagation speed: the speed at which the
storm cell is advancing.
To display weather fronts:
X
Activate the
Atmospheric Pressure
Atmospheric Pressure
dis-
play level (
Y
page 208).
If weather data is available, the weather
map will then display the weather fronts.
The example shows the position of high and
low-pressure areas (H, L), weather fronts
and isobars. Isobars are lines that show
where the air pressure is the same.
Legend: weather fronts
Weather
front
Explanation
Cold front
(blue line
with blue tri-
angles)
If a cold front moves in, the
weather remains changea-
ble and there are often rain
showers and thunder-
storms. The air tempera-
ture decreases.
Warm front
(red line with
red semi-cir-
cles)
A warm front may cause
more prolonged steady
rain, more cloud cover and
a slow rise in temperature.
Weather forecasts
209
SIRIUS
Weather