Archived 4/2/10 – ETS-Lindgren HI-1710 Microwave Measurement System (Archived) User Manual
Page 20
HI
n
1710 Manual
Page — 15
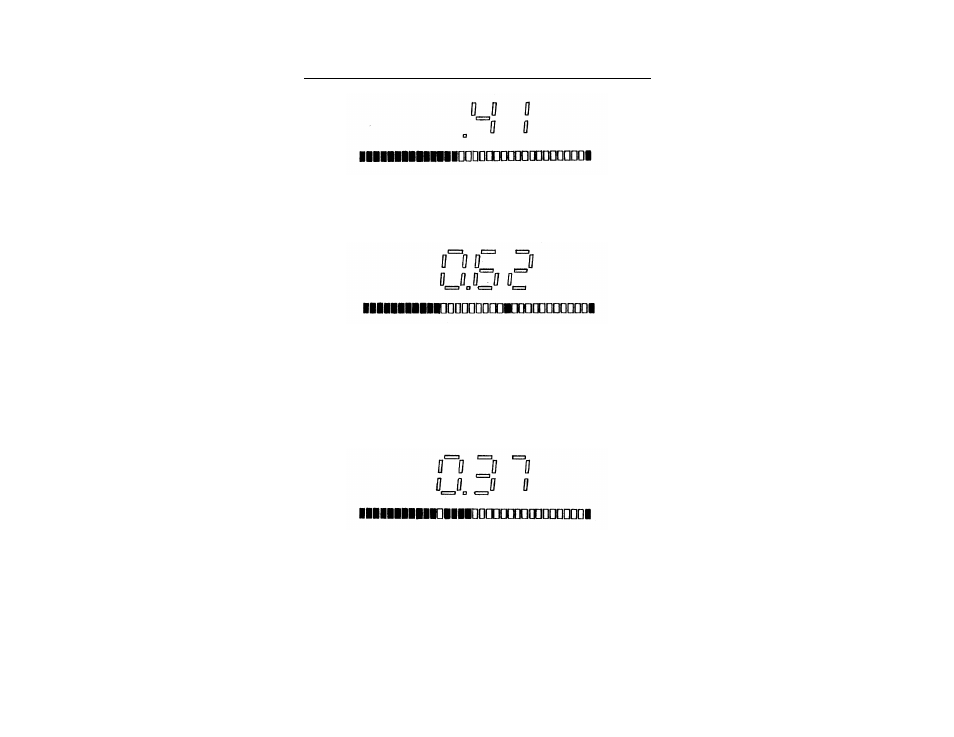
In NORMAL mode, the Bar Graph tracks
the digital display.
In PEAK mode, a single segment stays lit
to indicate the peak reading on the digital
display.
Bar Graph segments track the
instantaneous RF level.
In PEAK mode, when the instantaneous RF
level exceeds the filtered “peak” level on
the digital display, the “peak” level is
indicated by an unlit segment.
Figure 2
HI-1710 Bar Graph Display
Archived 4/2/10
See also other documents in the category ETS-Lindgren Equipment:
- SMART 200 Reverb Chambers (45 pages)
- 6402 Helmholtz Coil (24 pages)
- 3625-2 LISN (15 pages)
- 3701 Line Probe (15 pages)
- 3725-2M LISN (19 pages)
- 3810-2 LISN (25 pages)
- 3816-2 LISN (21 pages)
- 3850-2 LISN (19 pages)
- 4825-2 LISN (25 pages)
- 1052 Antenna Tower Positioner (23 pages)
- 2005 Single Axis Positioner (32 pages)
- 2090 Controller (178 pages)
- 2110 Multi-Axis Positioning Systems (MAPS) (48 pages)
- 2115 Multi-Axis Positioning Systems (MAPS) (48 pages)
- 2165 Turntable (46 pages)
- 2171B Boresight Antenna Tower (64 pages)
- 2175 Antenna Tower (41 pages)
- 2181 Turntable (44 pages)
- 2187 Turntable (36 pages)
- 2188 Turntable (39 pages)
- 7-TR Tripod Positioner (49 pages)
- 7000-001 EMCenter Modular RF Platform (41 pages)
- 7405 E & H Near Field Probe Set (51 pages)
- 91197-1 Current Probe (57 pages)
- 95236-1 Current Probe (27 pages)
- HI-1501 Microwave Oven Survey Meter (28 pages)
- HI-1600 Microwave Oven Survey Meter (26 pages)
- HI-1710A Microwave Oven Survey Meter (57 pages)
- HI-1801 Microwave Oven Survey Meter (24 pages)
- HI-2200 RF Survey Meter (53 pages)
- HI-2602 Interlock Monitor (22 pages)
- HI-2790B Calibration Comparison System (44 pages)
- HI-3603 VLF Survey Meter (55 pages)
- HI-3604 ELF Survey Meter (44 pages)
- HI-3624(A) Survey Meter (22 pages)
- HI-3627 ELF Magnetic Field Meter (36 pages)
- HI-3637 VLF Magnetic Field Meter (48 pages)
- HI-3638 ELV/VLF Electric Field Meter (41 pages)
- HI-3702 Induced Current Meter (34 pages)
- HI-3804 RF Industrial Compliance Meter (25 pages)
- HI-4416 Numeric EMF Readout Unit (38 pages)
- HI-4433-CH Magnetic Field Probe (42 pages)
- HI-6005 Electric Field Probe (152 pages)
- HI-6100 Field Monitor (71 pages)
- HI-6113 Laser Data Interface and Probe Measurement System (49 pages)