Displaying of the variables – Carlo Gavazzi WM4-96 User Manual
Page 13
▲
▲
13
Displaying of the variables
Access to the main menu
11
Displ. of partial energies
8
17
16
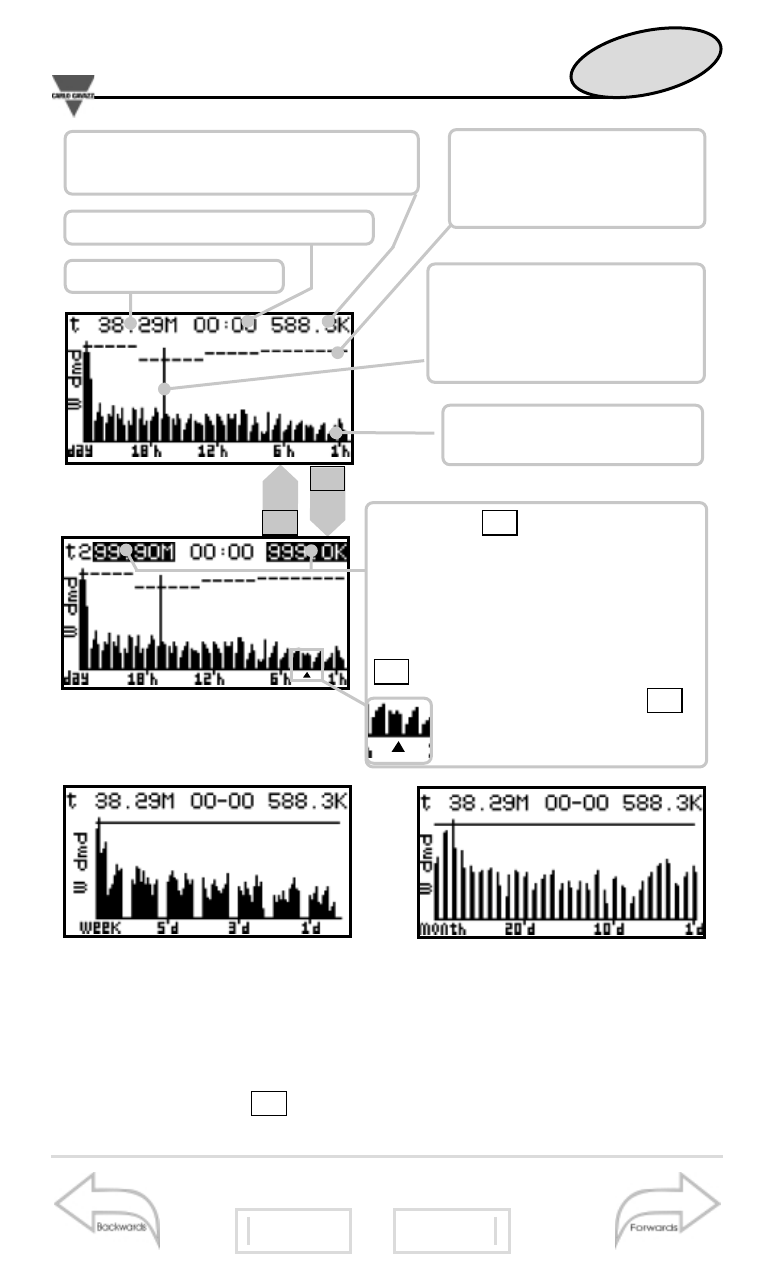
depending on the acquired data, dividing them into: daily,
weekly and monthly graph, as simplified by the figures shown
above. Press the
key: you can display the single integra-
tion periods and the details relevant to the installed power
F
Wdmd of the last integration
period
Time of the last integration
Installed power
Graphic representation
of the consumptions
Load profile of the
installed power divided
into hour time periods
Example: the con-
sumed power integrated
in 15 minutes exceeds
the installed power
Pressing
, the instrument
will display in detail the data indi-
cated by the arrow that will
appear on the abscissae axis.
To scroll the single data use the
keys. To exit the detailed
display mode press
.
F
F
F
Daily graph:
15-minute resolution,
total time: 24 hours.
Weekly graph:
2-hour resolution,
total time: 7 days.
Monthly graph:
12-hour resolution,
max. total time: 31 days.
F
F