Viewing a spectrum table, Viewing a frequency plot, Viewing synchronized waveforms – SATEC RDM172 Manual User Manual
Page 113
Chapter 4 PAS Application Software
Viewing Recorded Files
Series PM172 Powermeters
113
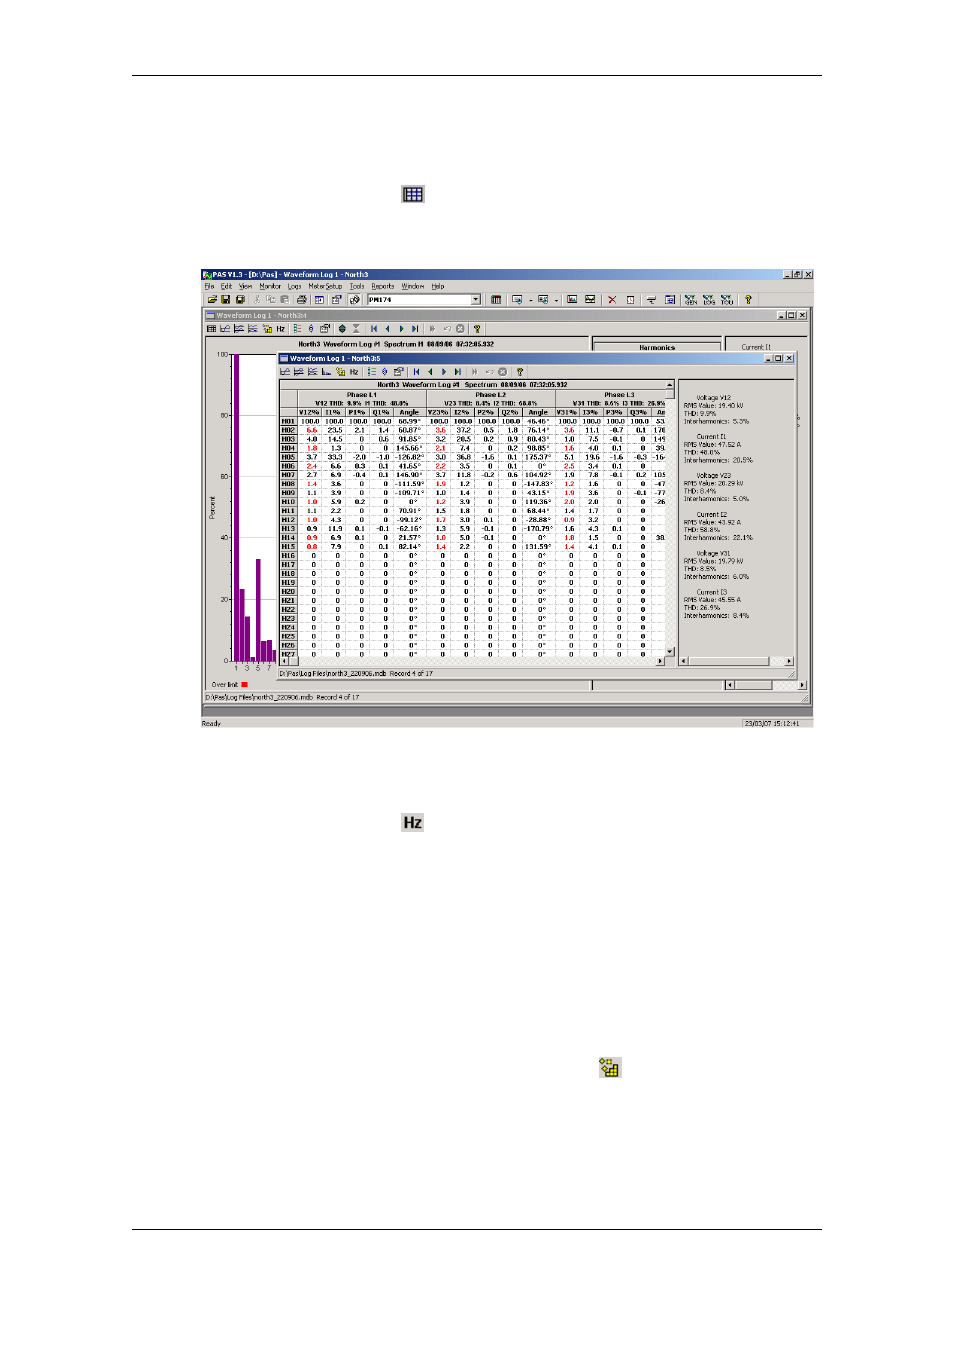
Harmonics that exceed selected compliance levels are colored in red on the
graph and in the tables.
Viewing a Spectrum Table
Click on the
button on the local toolbar. The spectrum table displays
voltage, current, active power and reactive power harmonic components
both in percent of the fundamental and in natural units, and phase angles
between the harmonic voltage and current.
To change a phase, click on the window with the right mouse button, select
“Options...”, check the phase you want displayed, and then click OK.
Viewing a Frequency Plot
Click on the
button to view a cycle-by-cycle voltage frequency plot.
Viewing Synchronized Waveforms
If you have a number of devices with synchronized clocks, you can view
waveforms recorded at different locations in one window. PAS synchronizes
the time axes for different waveforms so they could be displayed in a single
plot.
To get synchronized waveforms:
1. Put the databases with waveforms into the same folder, or put the sites
from which you have uploaded data to the same group in the sites tree.
2. Open a waveform you want to synchronize with other waveforms, and
then click on the Multi-site View button
. PAS searches for time-
coordinated waveforms that have the same time span as the selected
waveform.