Using a zoom, Customizing line colors and styles, Viewing an rms plot – SATEC RDM172 Manual User Manual
Page 111: Viewing a spectrum chart
Chapter 4 PAS Application Software
Viewing Recorded Files
Series PM172 Powermeters
111
select the desired units for voltages and currents on the Channels tab, and
then click OK.
Using a Zoom
Use the green arrowheads on the local toolbar to zoom in or out of the
waveform graph. Every click on these buttons gives you a 100-percent
horizontal or 50-percent vertical zoom. Use the magnifying glass buttons to
get a proportional zoom in both directions.
When in the overlapped waveform view, you can zoom in on a selected
waveform region. Click on the waveform window with the right mouse button,
click 'Zoom', point onto one of the corners of the region you want to zoom in,
press and hold the left mouse button, then point to another corner of the
selected region and release the mouse button.
Customizing Line Colors and Styles
To change the colors or line styles, click on the waveform window with the
right mouse button, select “Options...”, click on the Display tab, adjust colors
and styles, and then click OK. You can also change the waveform
background and gridlines color.
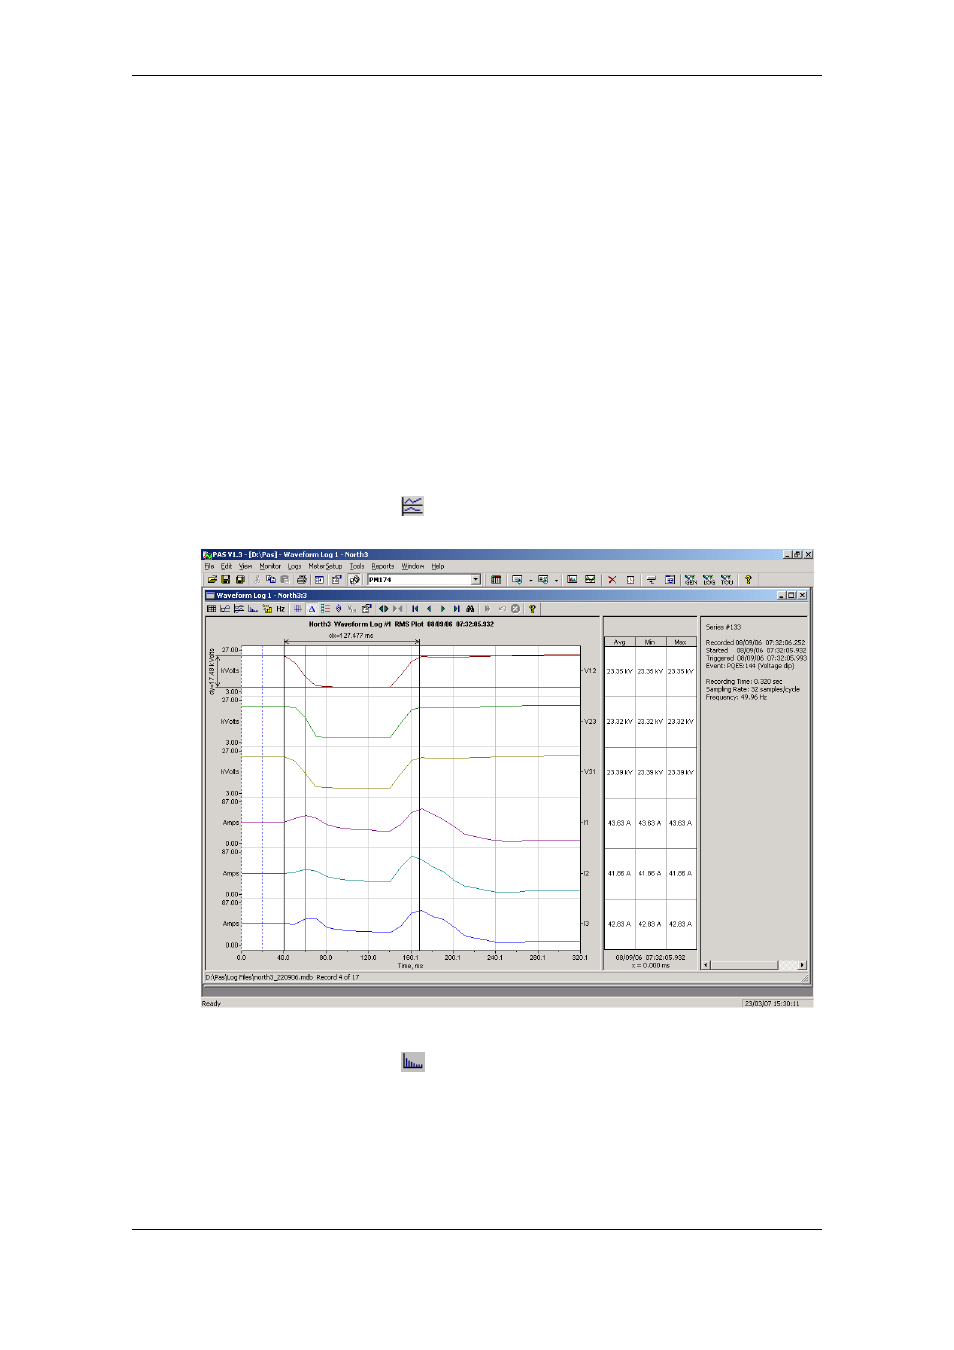
Viewing an RMS Plot
Click on the
button to open the RMS view. PAS shows you a cycle-by-
cycle RMS plot of the sampled AC waveforms.
Viewing a Spectrum Chart
Click on the
button to view a spectrum chart. To change a channel, click
on the window with the right mouse button, select “Channels...”, check the
channel you want displayed, and then click OK.
A spectrum is calculated over four cycles of the waveform beginning from the
point where the left marker line is located. If there are more than one
waveform views open, PAS gives the priority to the overlapped waveform
view.