Viewing recorded files, Viewing the device event log, Filtering and sorting events – SATEC RDM172 Manual User Manual
Page 107: Linking to waveforms and data records, Selecting primary and secondary units, Retrieving logs files, Viewing options
Chapter 4 PAS Application Software
Viewing Recorded Files
Series PM172 Powermeters
107
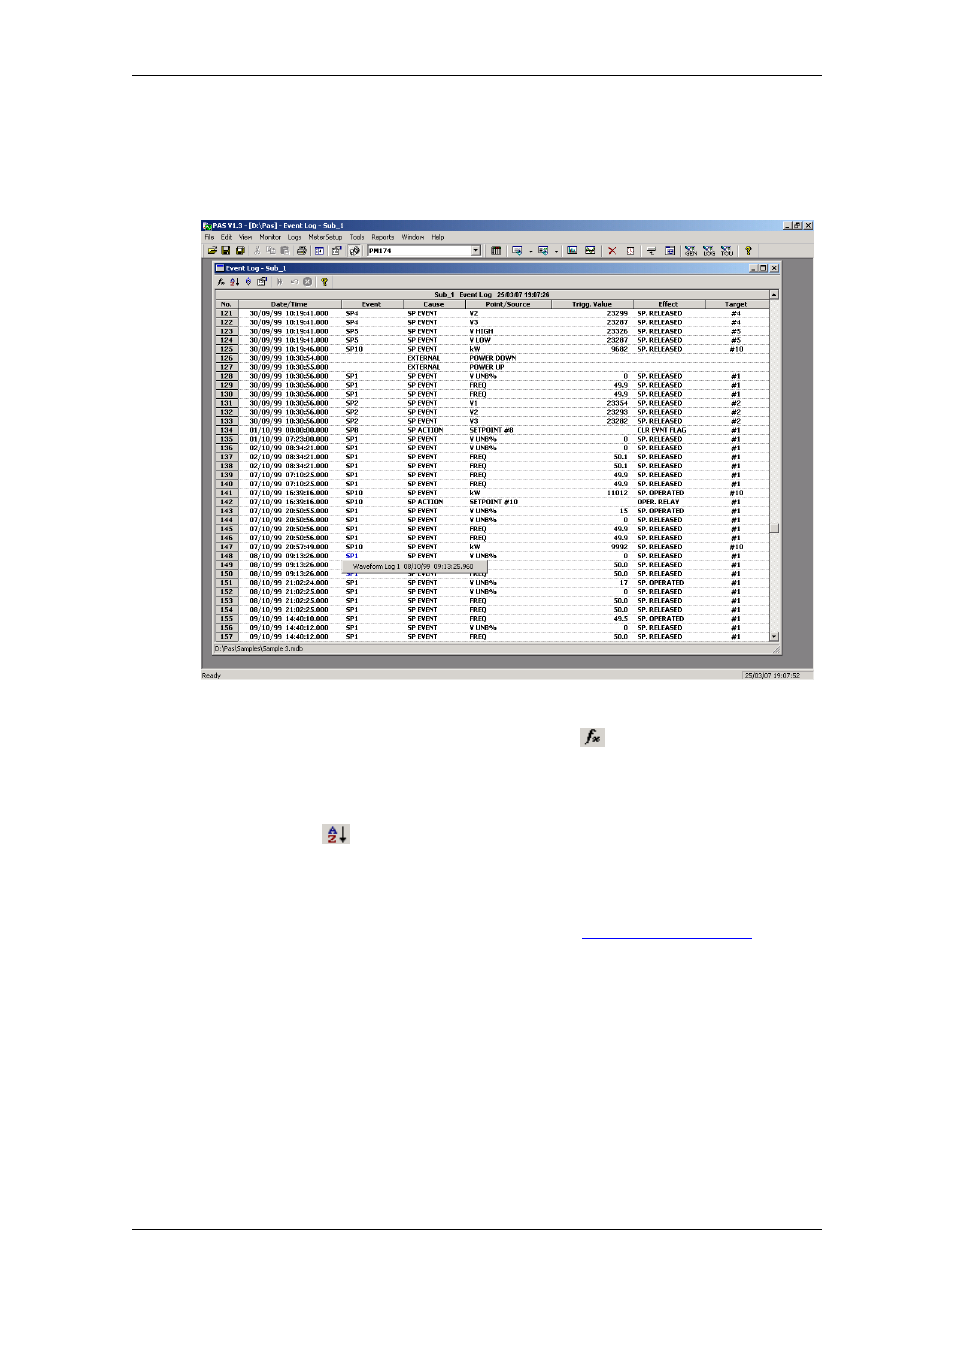
Viewing the Device Event Log
Event log files are displayed in a tabular view. PAS loads the entire database
table to a window, so that you can scroll through the entire log to view its
contents.
Filtering and Sorting Events
To filter events, click on the Filter button
, or click on the report window
with the right mouse button and select “Filter...”. Check the causes of events
you want to display, and then click OK.
Event records are normally shown in the order based on the date and time of
the event appearance. To change the sorting order, click on the Sort button
, or click on the report window with the right mouse button and select
“Sort...”, check the desired sort order, and then click OK.
Linking to Waveforms and Data Records
If a setpoint triggers the Waveform or Data recorder and is programmed to
log setpoint events to the Event log (see
), then
PAS automatically establishes links to retrieved waveforms and data records
where it finds a relationship with the event.
The event ID for which PAS finds related data is blue colored. To check a list
of the event links, click on the colored event ID. Click on a list item to move
to the waveform or data log record.
Selecting Primary and Secondary Units
Voltages and currents can be displayed in primary or secondary units. Click
on the report window with the right mouse button, select Options, select the
desired units for voltages and currents, and then click OK.