Filter plots, Figure 17. single-speed stopband rejection, Figure 18. single-speed stopband rejection – Cirrus Logic CS5346 User Manual
Page 35: Figure 19. single-speed transition band (detail), Figure 20. single-speed passband ripple, Figure 21. double-speed stopband rejection, Figure 22. double-speed stopband rejection, Figure 17.single-speed stopband rejection, Figure 18.single-speed stopband rejection, Figure 19.single-speed transition band (detail)
DS861PP3
35
CS5346
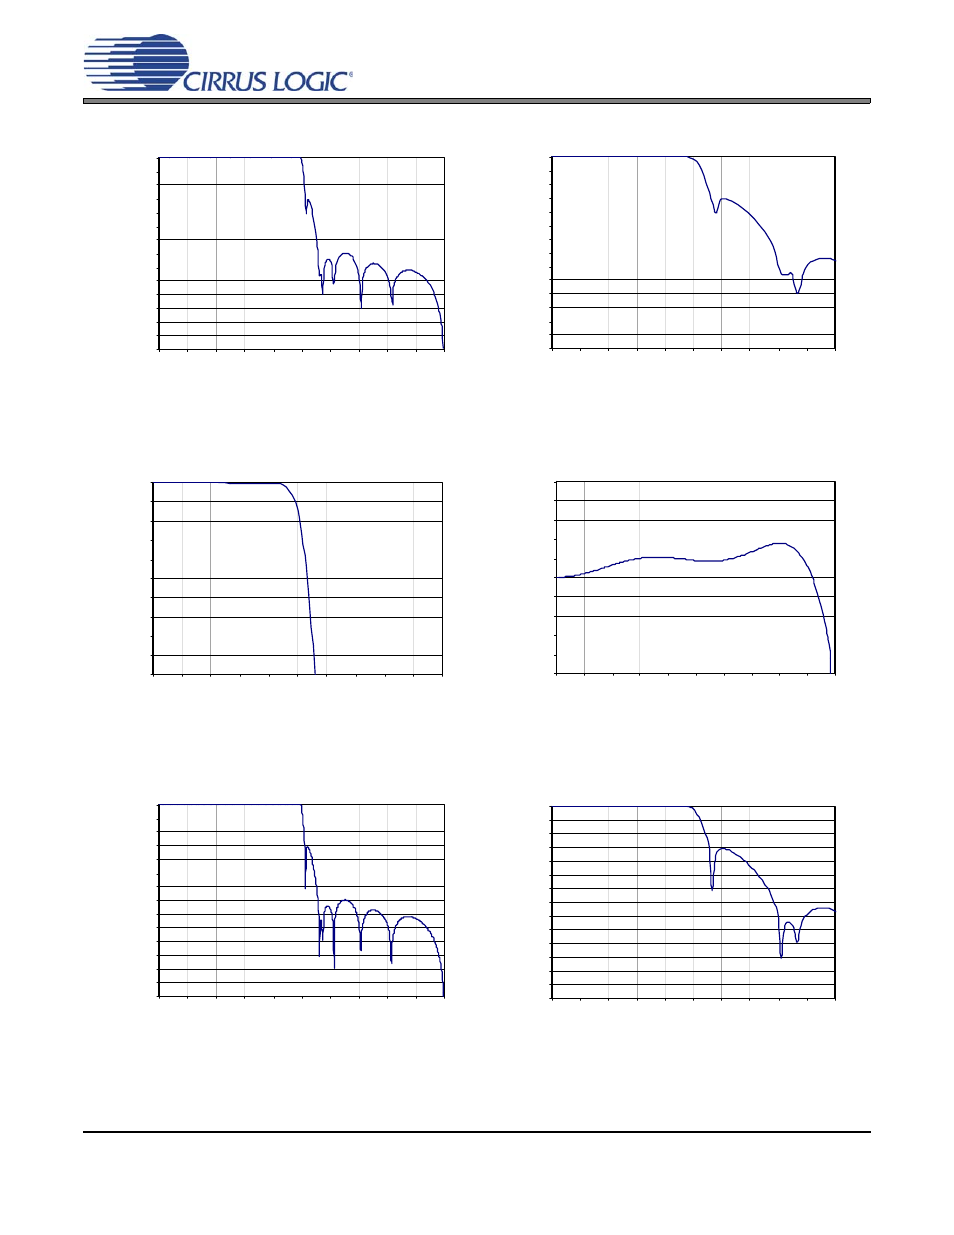
9. FILTER PLOTS
Figure 17. Single-Speed Stopband Rejection
Figure 18. Single-Speed Stopband Rejection
Figure 19. Single-Speed Transition Band (Detail)
Figure 20. Single-Speed Passband Ripple
Figure 21. Double-Speed Stopband Rejection
Figure 22. Double-Speed Stopband Rejection
-140
-130
-120
-110
-100
-90
-80
-70
-60
-50
-40
-30
-20
-10
0
0.0
0.1
0.2
0.3
0.4
0.5
0.6
0.7
0.8
0.9
1.0
Frequency (normalized to Fs)
Amplitude
(dB)
-140
-130
-120
-110
-100
-90
-80
-70
-60
-50
-40
-30
-20
-10
0
0.40 0.42 0.44 0.46 0.48 0.50 0.52 0.54 0.56 0.58 0.60
Frequency (normalized to Fs)
Amplitude
(dB)
-10
-9
-8
-7
-6
-5
-4
-3
-2
-1
0
0.45 0.46 0.47 0.48 0.49 0.5
0.51 0.52 0.53 0.54 0.55
Frequency (normalized to Fs)
Amplitude
(dB)
-0.10
-0.08
-0.06
-0.04
-0.02
0.00
0.02
0.04
0.06
0.08
0.10
0
0.05 0.1 0.15 0.2 0.25 0.3 0.35 0.4 0.45 0.5
Frequency (normalized to Fs)
Amplitude
(dB)
-140
-130
-120
-110
-100
-90
-80
-70
-60
-50
-40
-30
-20
-10
0
0.0
0.1
0.2
0.3
0.4
0.5
0.6
0.7
0.8
0.9
1.0
Frequency (normalized to Fs)
Amplitude
(dB)
-140
-130
-120
-110
-100
-90
-80
-70
-60
-50
-40
-30
-20
-10
0
0.40 0.42 0.44 0.46 0.48 0.50 0.52 0.54 0.56 0.58 0.60
Frequency (normalized to Fs)
Amplitude
(dB)