Avaya P130 SMON User Manual
Page 35
Avaya P130 SMON User Guide
28
Extended Port Statistics
SMON continuously monitors statistics for all available Extended Port
Statistics traffic variables, even those that are not currently selected. For
information on finding the 5 highest peaks of traffic, refer to
Using the Find Top5 Peaks Dialog Box
.
The X axis of the graph represents time. The units of the Y axis for all
variables are packets. The scale on the Y axis depends on the maximum
value among all of the variables. If the spread of values is wide, the graphs
of variables with small values may not be visible. In this case, use the
logarithmic traffic display to produce better results (refer to Appendix A,
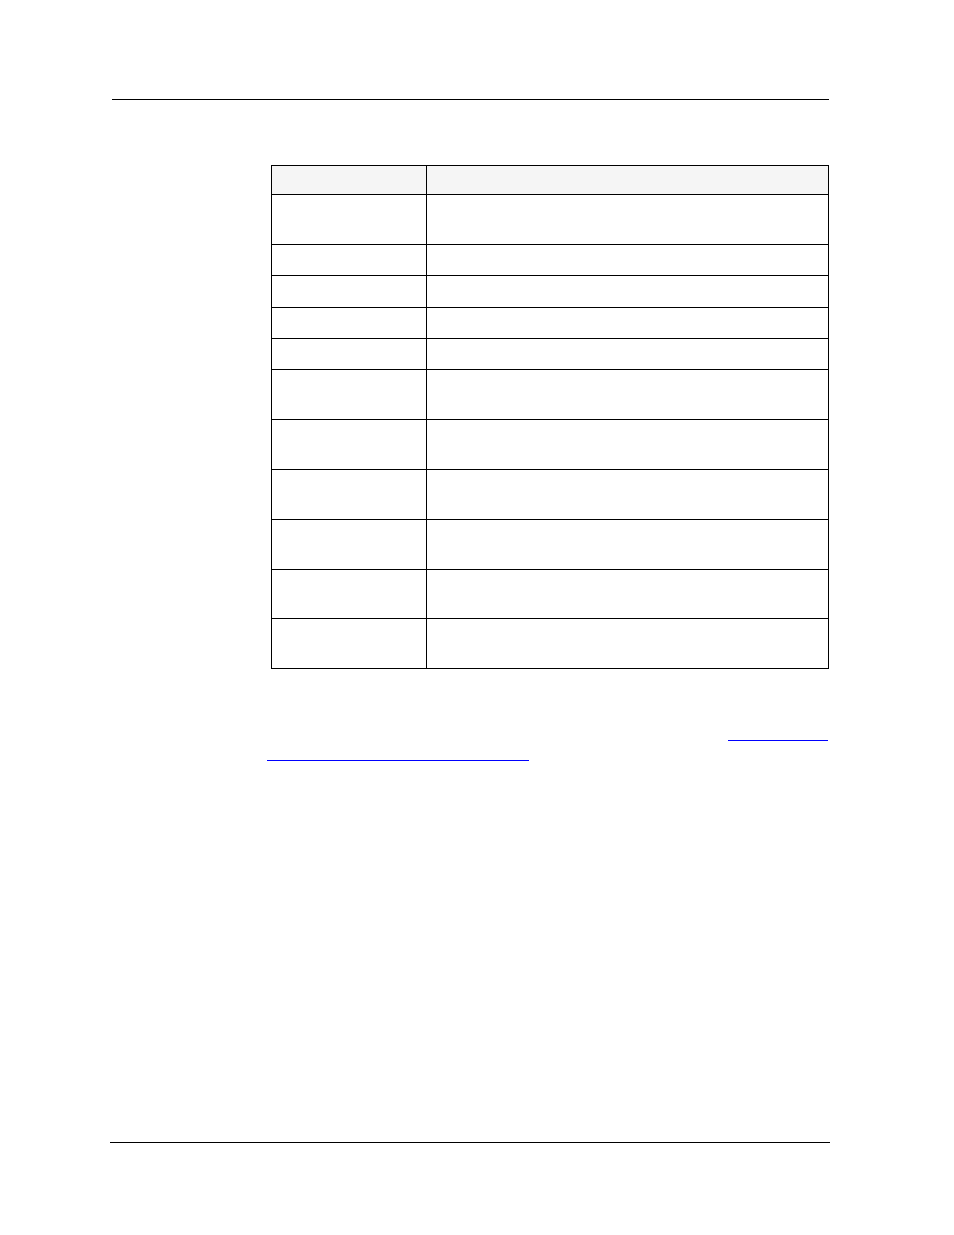
Bad In CRC Align
The number of packets entering the port with a CRC
Alignment error.
Bad In Undersize
The number of undersize packets entering the port.
Bad In Oversize
The number of oversize packets entering the port.
Bad In Fragments
The number of fragmented packets entering the port.
Bad In Jabber
The number of jabber packets entering the port.
64 Octet
The number of packets on the port with a packet length
of 64 octets.
65 to 127 Octets
The number of packets on the port with a packet length
of between 65 and 127 octets.
128 to 255 Octets
The number of packets on the port with a packet length
of between 128 and 255 octets.
256 to 511 Octets
The number of packets on the port with a packet length
of between 256 and 511 octets.
512 to 1023 Octets The number of packets on the port with a packet length
of between 512 and 1023 octets.
1024 to 1518
Octets
The number of packets on the port with a packet length
of between 1024 and 1518 octets.
Table 5-3. Traffic Graph Counters in
Extended Port Statistics (Continued)
Variable
Description