9 drawing a bar graph, 10 initializing a strip chart – Matrix Orbital GLT240128 Legacy User Manual
Page 39
Description
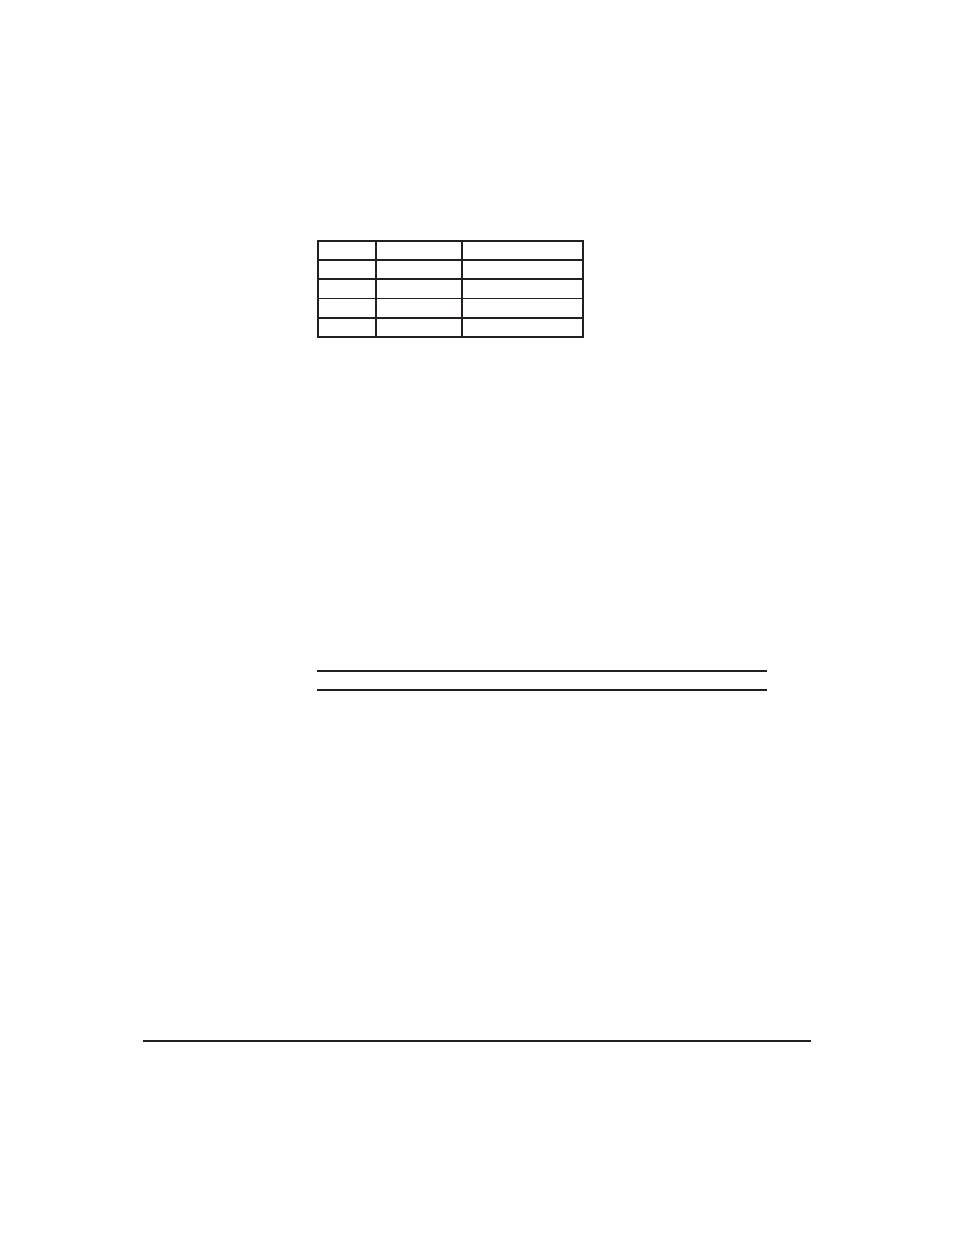
This command initializes a bar graph referred to by number [reference
number] of type [type] with size from (x1,y1) (top left) to (x2,y2)
(bottom right). A maximum of 16 bar graphs with reference numbers
from 0 to 15 can be initialized as:
[type]
Direction
Bar Start Point
0
Vertical
Bottom
1
Horizontal
Left
2
Vertical
Top
3
Horizontal
Right
The bar graphs may be located anywhere on the display, but if
they overlap, they will not display properly.
It is important that [x1] is less than [x2], and [y1] is less than [y2]. This
command doesn’t actually draw the graph, it must be filled in using the
Fill Bar Graph command. The unit saves time by only drawing that part
of the bar graph which has changed from the last write, so the represen-
tation on the screen may not survive a screen clear or other corrupting
action. A write of value zero, followed by new values will restore the
proper look of the bar graph.
Remembered
No
8.9
Drawing a Bar Graph
Syntax
Hexadecimal
0xFE 0x69 [ref] [value]
Decimal
254 105 [ref] [value]
ASCII
254 “i” [ref] [value]
Parameters
Parameter
Length
Description
ref
1
Initialized bar graph reference
number.
value
1
The number of pixels to fill.
Description
Once the bar graph has been initialized it can be filled in using this
command. This command sets the bar graph specified by the [ref]
number to fill in [value]. [value] is given in pixels and should not
exceed the available height/width of the graph. (If it does the graph will
simply be written to its maximum size.)
Remembered
No
8.10
Initializing a Strip Chart
Syntax
Hexadecimal
0xFE 0x6A [refID] [x1] [y1] [x2] [y2]
Decimal
254 106 [refID] [x1] [y1] [x2] [y2]
ASCII
254 “j” [refID] [x1] [y1] [x2] [y2]
Matrix Orbital
GLT240128
34