Compound test chart, Advanced | display evaluation tools – Monoprice 9497 Disney World of Wonder User Manual
Page 25
46
47
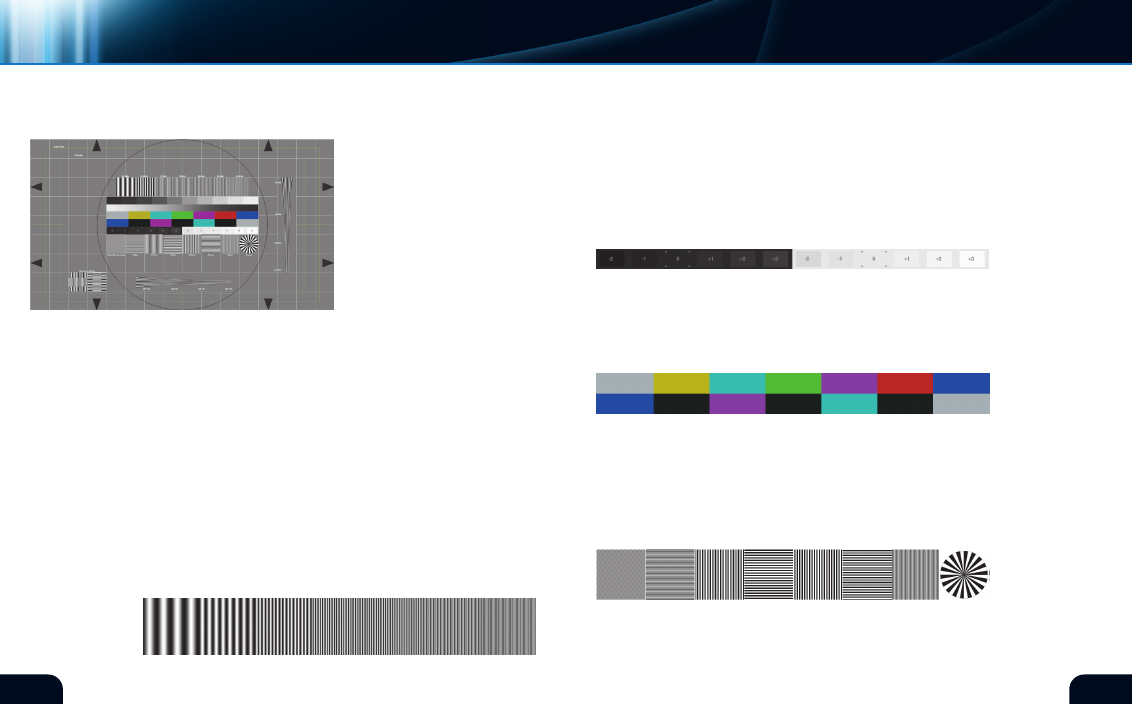
As a quick reference, this chart
(figure 57) embodies many of
the patterns found elsewhere on
this disc. It also contains unique
patterns used for checking
display response and alignment.
It is not intended to be used as
an ultimate setup tool, rather as
a “status at a glance” to quickly
check a display device for
proper operation.
The background of this chart embodies the crosshatch pattern
and edge marking arrows found elsewhere on this disc. Use these
elements to gauge the basic sizing and geometry of your display
system. A centered circle assists in determining whether proper
aspect ratio is present. Also present are Action Safe and Title Safe
boundaries representing commonly used margins for screen content.
A multiburst signal (figure 58) indicates basic frequency response
of your display system. If your display uses analog connections, the
portions of this test strip with higher packing density may begin
to degrade into a flat grey field instead of showing the high details
within. The markings on individual chips on this chart will help
quantify the limits of your display system.
coMponents
COmpOUND tEst ChaRt
(figure 57)*
(figure 58)*
A PlUGE strip with ideal black and ideal white labeled with a “0”
(zero) mark, along with several shades on either side, may be used
to check the brightness and contrast adjustments of your display
(figure 59). The black +1 chip should be visible while the -1 and
-2 chips should not with proper brightness settings. Similarly, the
white +1 chip should be visible to confirm proper contrast settings.
Use the appropriate full screen PlUGE patterns, located elsewhere
in this disc, if adjustment is necessary.
A color Bar strip displays the basic accuracy of hue and color
levels (figure 60). Use the blue filter provided to check this setting
if necessary. Use the full screen color bar signal found elsewhere on
this disc to confirm proper color alignment.
Elements testing for resolution performance and scaling artifacts
are seen in multiple pixel count chips including one, two and three
pixel patterns on a single strip (figure 61). Several of these patterns
are found as full screen charts elsewhere on this disc. Also present
in this compound test chart is a basic focus wedge to assist with
setting up projection equipment.
Vertical and horizontal wedge patterns will quickly determine the
amount of degradation present in high resolution elements. The
vertical wedge (right side, figure 57) is calibrated in mHz while
(figure 59)*
(figure 60)*
(figure 61)*
advanced | DISPlAY EVAlUATIOn TOOlS
Monitor selection
*Digital Reference Standard
*Digital Reference Standard