White-black clipping test, Advanced | display evaluation tools – Monoprice 9497 Disney World of Wonder User Manual
Page 22
40
41
test signal. Some amount of aliasing is normal due to the limitations
of video systems. However, irregularities in signal processing or
display technology will show themselves using this pattern.
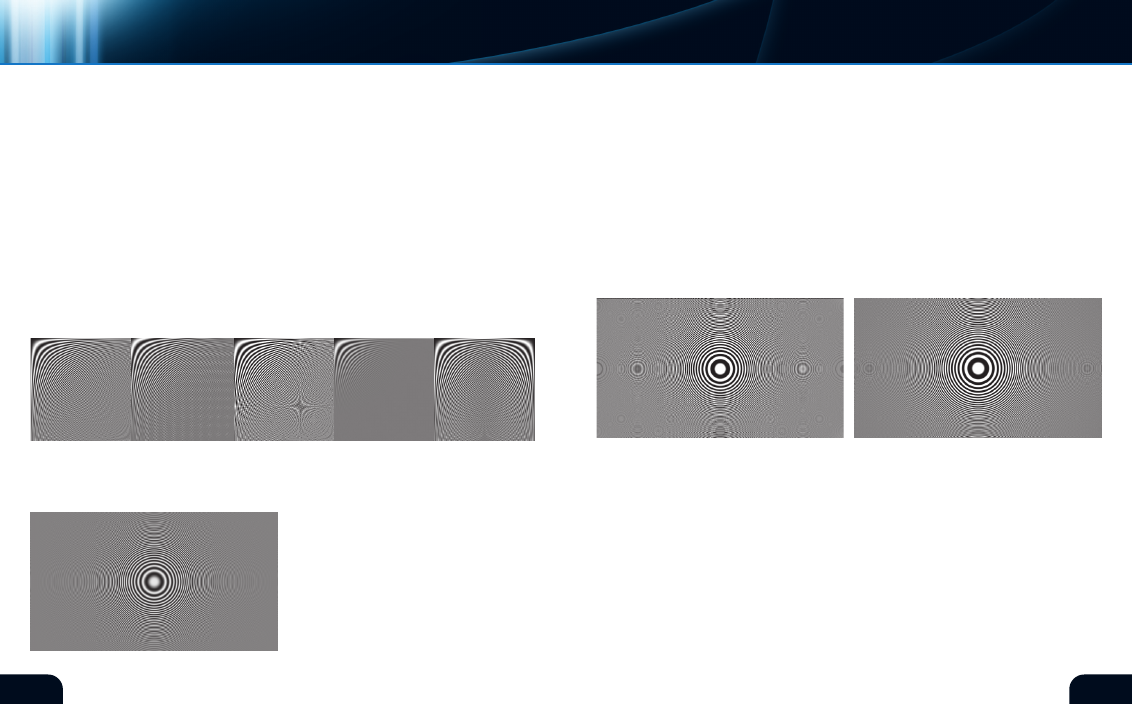
Below are several examples of what the hyperbolic zone plate
may show (figure 49). The first box on the left is a section of the
original test signal without impairments. In a perfect system, the
test signal will be displayed unaltered. The second example shows
scaling artifacts indicated by regular horizontal and vertical aliases.
The third example shows filtering artifacts from applying too much
sharpness, causing adjacent video elements to interact with each
other. The fourth example shows a lack of high detail. There are
many other variations of these artifacts, which may require more
thorough analysis by professionals.
This test signal consists of concentric rings with increasing packing
density as they move away from the focal point. This test pattern
contains elements that cross many boundaries within a video
system, possibly revealing aliases caused
by scaling, interlacing, filtering or poor
alignment (figure 50).
To the right are two examples (figure 51) of
possible artifacts that stem from filtering
and scaling the original test pattern. If the
test pattern on your monitor displays fairly
sinusoidal
Zone plate
extreme artifacts or aliases, you may also see other impairments on
program video. consult a service technician to diagnose and find a
possible solution to the problem.
On interlaced display systems, this test pattern may show artifacts
due to interlace “twitter.” The impairments found in interlaced
video are inherent in the format. Attempts to remedy the artifacts
may solve the impairments but may well introduce others. If your
equipment has settings and adjustments that relate to smoothing
or filtering, test the settings with the zone plates to gauge their
effects on program video.
(figure 50)*
coMpound checkerboard
This is a moving test chart that embodies many elements of the
individual white and black checkerboard charts. It also contains a
test area to determine the actual black and white clip points for
your display (figure 52, see next page).
The middle dark band of the test pattern is used to adjust the residual
brightness on the monitor so that the darkest geometric shapes on
briGhtness
WhItE-BLaCK CLIppING tEst
advanced | DISPlAY EVAlUATIOn TOOlS
Monitor selection
(figure 49)*
(figure 51)
*Digital Reference Standard