DAVIS CarChip Online Help (8210, 8211, 8220, 8225) User Manual
Page 45
Welcome to CarChip
41
•
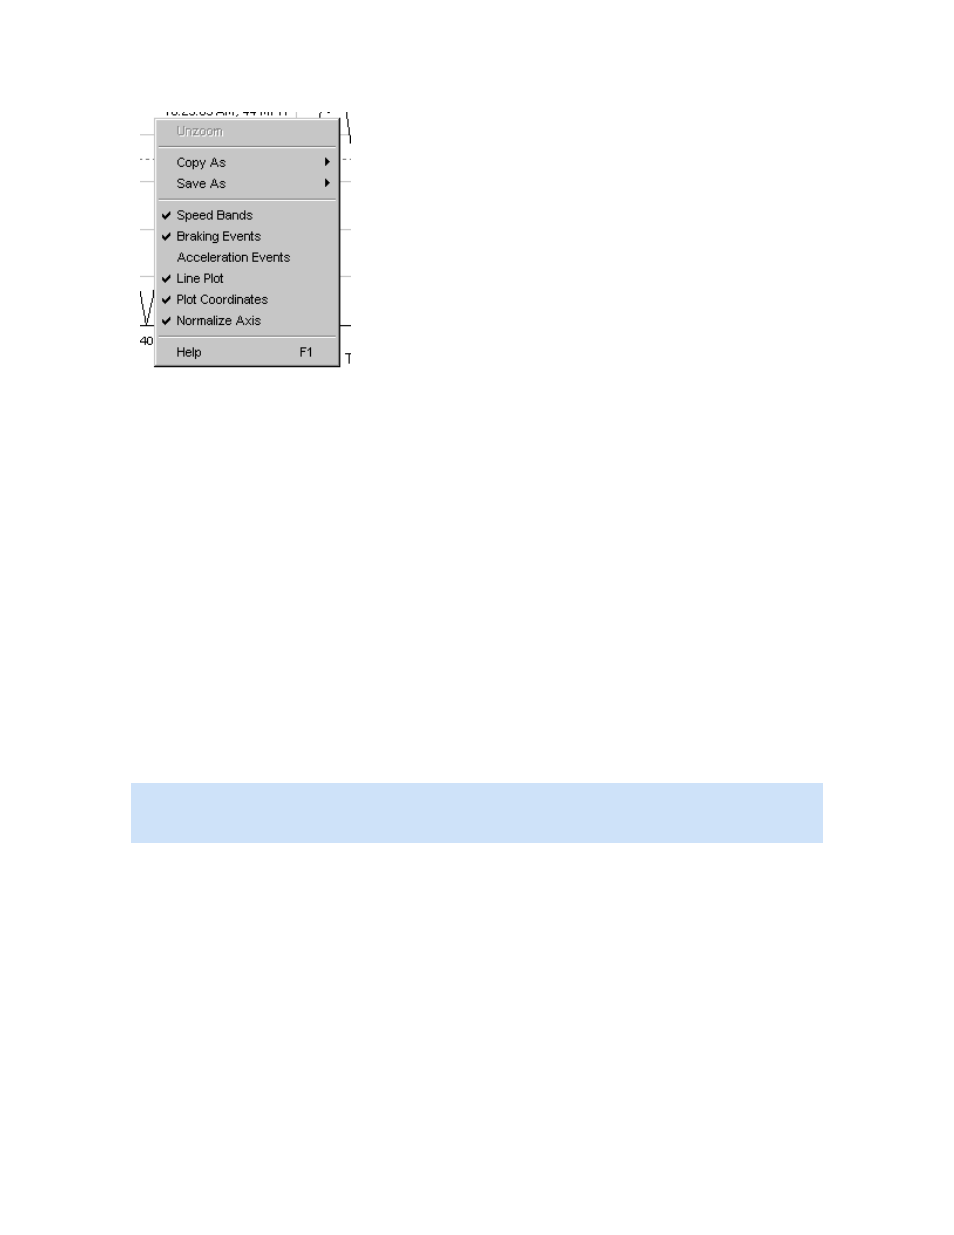
Unzoom
•
Copy As
•
Save As
•
Speed Bands - Select to include horizontal lines indicating speed band settings.
•
Braking Events - Select to draw vertical lines indicating braking events that exceed a braking
threshold.
•
Acceleration Events - Select to include vertical lines indicating acceleration events that exceed an
acceleration threshold.
•
Line Plot - Select to draw plots using plain lines. If not selected the area under the lines is filled in
with black.
•
Plot Coordinates - Select to display the cursor coordinates inside the plot view window.
•
Normalize Axes - Select to use the same upper speed range for all Speed Plots. The upper end of
the speed range is set in the Setup / Plots dialog box. Click the Options button in the plot window
to change the upper speed range.
•
Help F1
Trip Log Table View
The Trip Log Table view displays the all the values, including vehicle speed and any other selected
parameters, that were sampled by the CarChip data logger through the duration of the trip.
Note: The trip data that displays in the table view depends on CarChip data logger model. The basic
CarChip displays only the vehicle speed in the table view. The CarChip E/X or higher model displays the
data for any additional parameters that have been selected.
To view the Trip Log Table:
Click the Trip Log View icon or Select Trip Log from the View menu. The Trip Log Summary view
displays.
1. Click on the Trip Log drop-down box to display a list of all trips recorded in the Trip Log. The drop-
down list box always begins with the Summary view, with each recorded trip listed in order below
the Summary.