DAVIS CarChip Online Help (8210, 8211, 8220, 8225) User Manual
Page 23
Welcome to CarChip
19
•
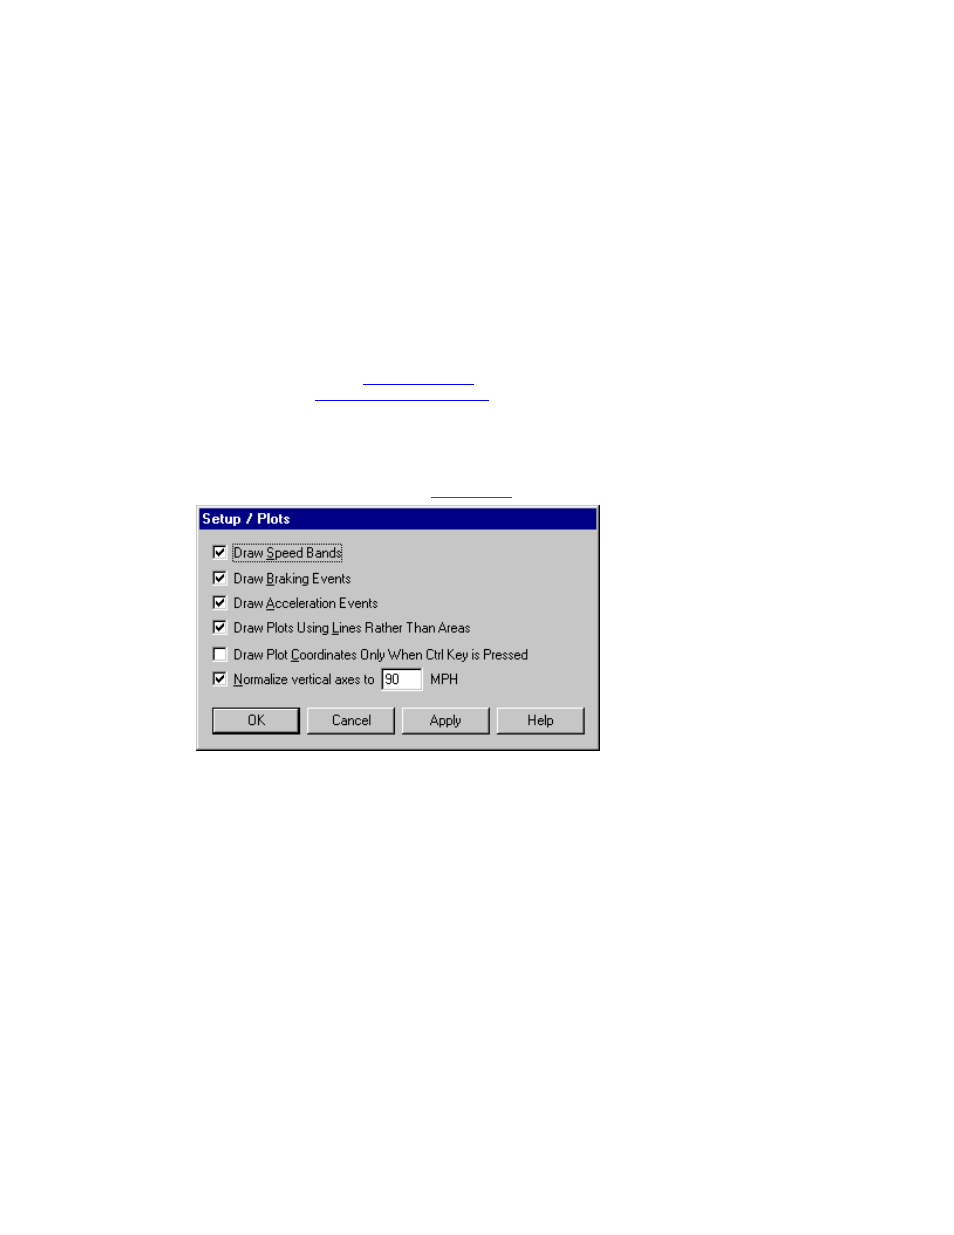
Draw Plots using Lines Rather than Areas - Displays a line graph of the measured data. Turning
this option off turns the area under the measured data black in the plot.
•
Draw Plot Coordinates Only When Ctrl Key is Pressed - Display the cursor's plot coordinates
only when the Control key is pressed. The plot coordinates are the elapsed time of the trip and the
data value associated with that time. If not checked, the cursor's coordinates on the plot are
displayed continuously when the cursor is within the plot area.
•
Normalize vertical axes to ___ MPH / KPH - Set the upper limit of the vehicle speed plot to the
speed of your choice. You can change the speed used to normalize the axes by highlighting the
current speed setting with your cursor and then entering the new speed. If not checked, the upper
limit of the vertical axes will be the maximum speed achieved by the vehicle during the current trip.
3. Click OK to save the new plot options. Click Cancel to exit the dialog box and retain the previous
plot options.
Draw Acceleration Events
The Draw Acceleration Events check box in the Setup / Plots dialog box displays any hard and
extreme acceleration events in the
Trip Log Plot view
when selected. The thresholds for hard and extreme
accelerations are set in the
Set Acceleration Thresholds
dialog box.
If the Draw Acceleration Events box is selected from the Setup / Plots dialog box, the acceleration
events are represented by blue vertical lines. A hard acceleration event is a dotted blue vertical line. An
extreme acceleration event is a solid blue vertical line.
To display acceleration events in the plots:
1. Select Plots from the Setup menu. The
Setup / Plots
dialog box displays.
2. Click the Draw Acceleration Events check box to toggle the function on and off. A check indicates
that the Draw Acceleration Events function has been enabled.
3. Click OK to save the new plot setup. Click Cancel to exit the dialog box and retain the previous plot
setup. Click Apply to make the change without exiting the dialog box.
Draw Braking Events
The Draw Braking Events check box in the Setup / Plots dialog box displays any hard and extreme
braking events in the Trip Log Plot view when selected. The thresholds for hard and extreme braking are
set in the Set Braking Thresholds dialog box.
If the Draw Braking Events box is selected from the Setup / Plots dialog box, the braking events are
represented by red vertical lines. A hard braking event is a dotted red vertical line. An extreme braking
event is a solid red vertical line.
To display acceleration events in the plots:
1. Select Plots from the Setup menu. The Setup / Plots dialog box displays.