Figure 9 graphs indicating changes in port traffic, Xp performance control restrictions, 9 graphs indicating changes in port traffic – HP StorageWorks XP Remote Web Console Software User Manual
Page 13: Figure 9
XP Performance Control user guide
13
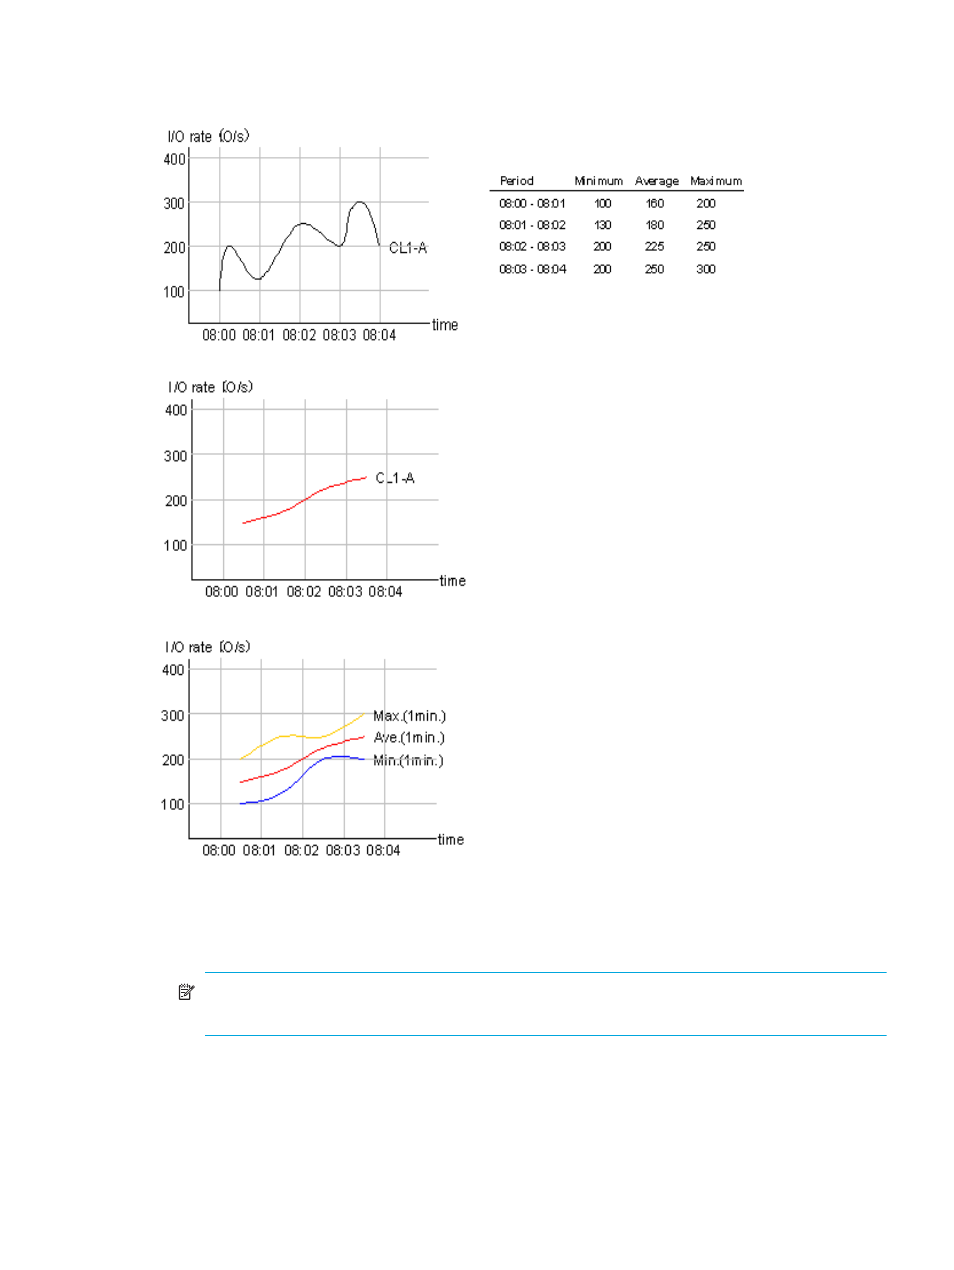
minute), if you set an upper limit of 150 IO/s to port 1A, the highest data point in the line CL1-A in
Graph 2 and the line Ave.(1 min) in Graph 3 is around 150 IO/s. The lines Max (1 min.) and Min (1
min.) in Graph 3 might exceed the upper limit.
Figure 9
Graphs indicating changes in port traffic
•
XP Continuous Access. XP Performance Control monitors write I/O requests issued from initiator ports
of the array.
NOTE:
When using continuous access functions, XP Performance Control monitors write I/O
requests issued from initiator ports to the array.
If you specify an RCU target port as a prioritized port, I/O requests from the initiator port will be a
target of threshold control. If you specify an RCU target port as a non-prioritized port, I/O requests
from the initiator port will not be a target of upper limit control.
XP Performance Control restrictions
The following restrictions apply to the XP Performance Control panes:
Graph 1: Actual I/O rate (measured every second)
Graph 2: I/O rate displayed in XP Performance Control (with Detail option)
Graph 3: I/O rate displayed in XP Performance Control (without Detail option)