Y axis, Y axis -20 – HP Storage Mirroring Software User Manual
Page 39
5 - 20
z
Unit—The base unit for the y axis.
z
Scale To—The multiplier to scale the y axis to. If set automatically, the y axis is scaled to the
highest possible multiplier.
z
Fields in View—List of fields in the view. The include checkbox controls whether the field
should be included when rendering the report. This is useful in dashboard editing where it is
not possible to adjust the report definition and the only way to drop fields is from this
parameter. If the chart has two views, the fields can be moved between the two views.
3.
Specify which data series should be plotted on this data view. If you have multiple data views,
you can move the series to the second data view by selecting it from the
Fields list and clicking
the
> button.
4.
You can disable a data series on a data view by deselecting the
Include checkbox.
5.
When you are finished, click
OK.
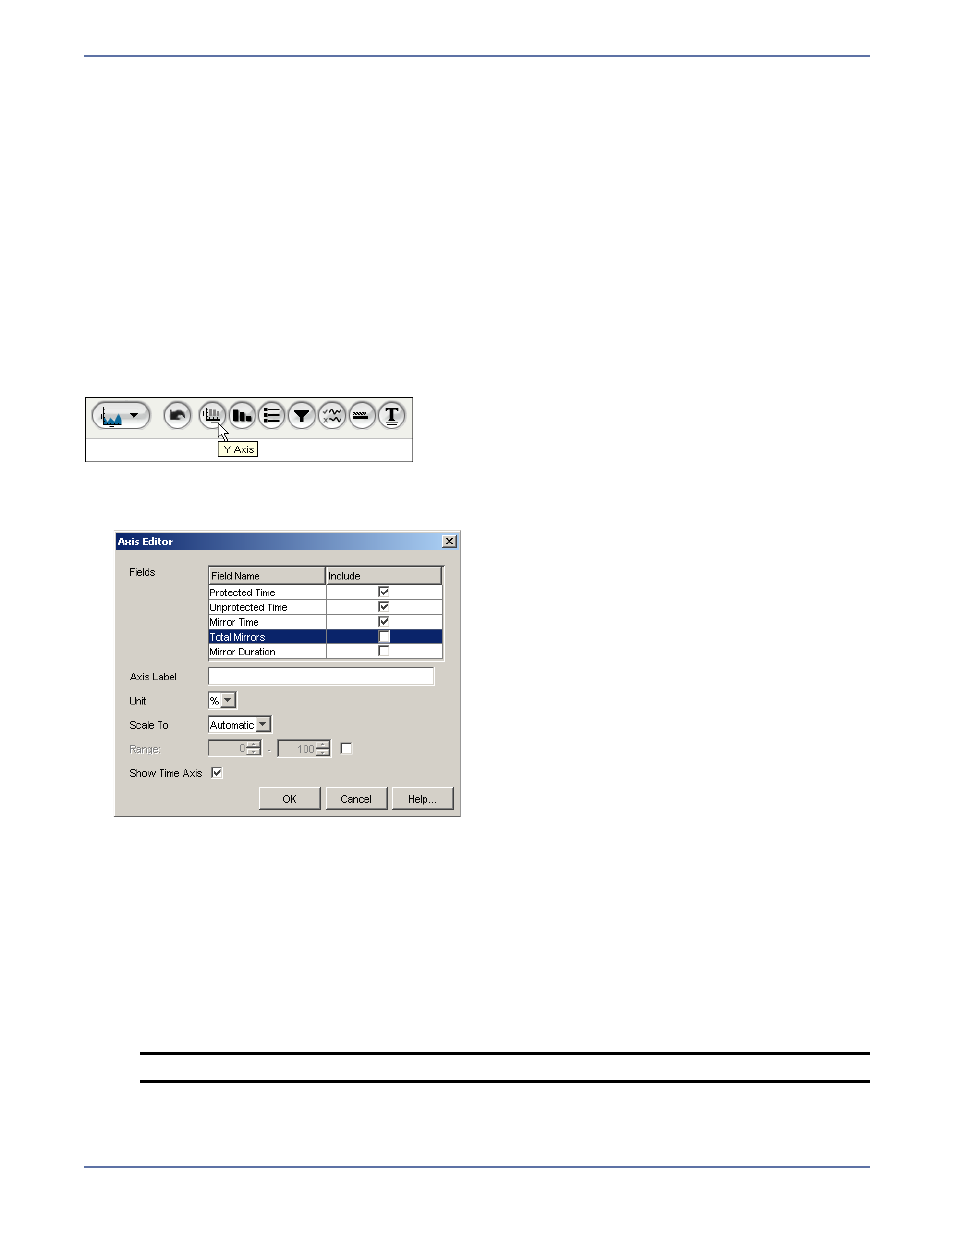
Y axis
The Y axis appearance parameter allows you to configure the Y axis on a chart.
To configure the y axis parameter:
1.
Click
Y Axis icon. The Axis Editor dialog box appears.
2.
Specify the fields in the Axis Editor dialog box:
z
Fields—Fields included in the report. Select the Include checkbox to include the field in the
report.
z
Axis Label—Title of the Y axis.
z
Unit—Base unit of the Y axis.
z
Scale To—Multiplier the data plotted along the axis is to be scaled. Automatic scales to the
highest possible multiplier.
z
Range—When included, the range restricts the Y axis to the given minimum and maximum.
z
Show Time Axis—If selected, the report data is displayed on a time-based axis. If
deselected, data is displayed as point-in-time.
3.
Click
OK.
NOTE:
This field is only available for some types of charts.