Legend option, Legend option -16 – HP Storage Mirroring Software User Manual
Page 35
5 - 16
4.
In the
Grid Color field, select a color to be used for chart grids.
5.
In the
Plot Area Color field, select a color for the area where the main chart is plotted. In case
of 3D chart, this color will be applied to the walls of the cube containing the 3D chart.
6.
In the
Axis Color field, select a color for the axis and axis text.
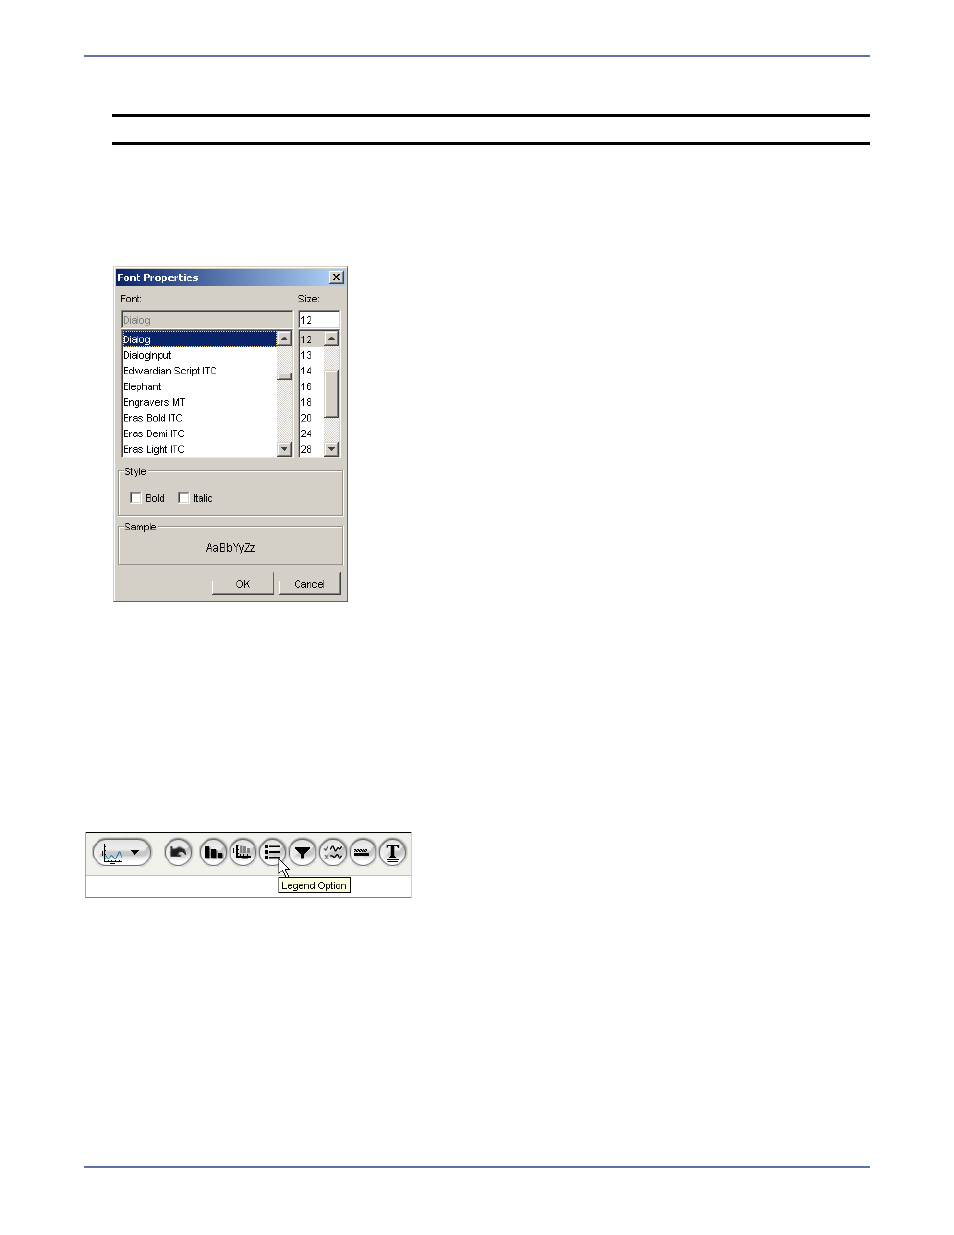
7.
To specify a font for the axis label text, clear the
User Selected checkbox, then click the Font
button. The Font Properties dialog box appears.
8.
Select the
Font, Size, and Style, then click OK.
9.
After making your changes, click
OK. The changes you made are reflected in the report display
area.
Legend option
All two-dimensional charts provide the ability to customize the behavior of the legend that is
displayed within the chart.
By default, charts display the legend if there is enough space to display it without significantly
affecting the size of the report. You can modify this behavior either to always or never display the
legend.
The Legend Option sets whether to display or hide the legend. If set to
Automatic, the legend is
displayed if the number of series is less than twelve.
NOTE:
This applies only to charts with grids.