Data views, Data views -19 – HP Storage Mirroring Software User Manual
Page 38
5 - 19
Data views
A data view on a chart is the object against which a data series is plotted. A chart can have two data
views. The data view appearance parameter provides the ability to control the following:
z
Number of data views to display on the chart
z
Data view against which a series should be plotted
z
How the axis within that data view is presented
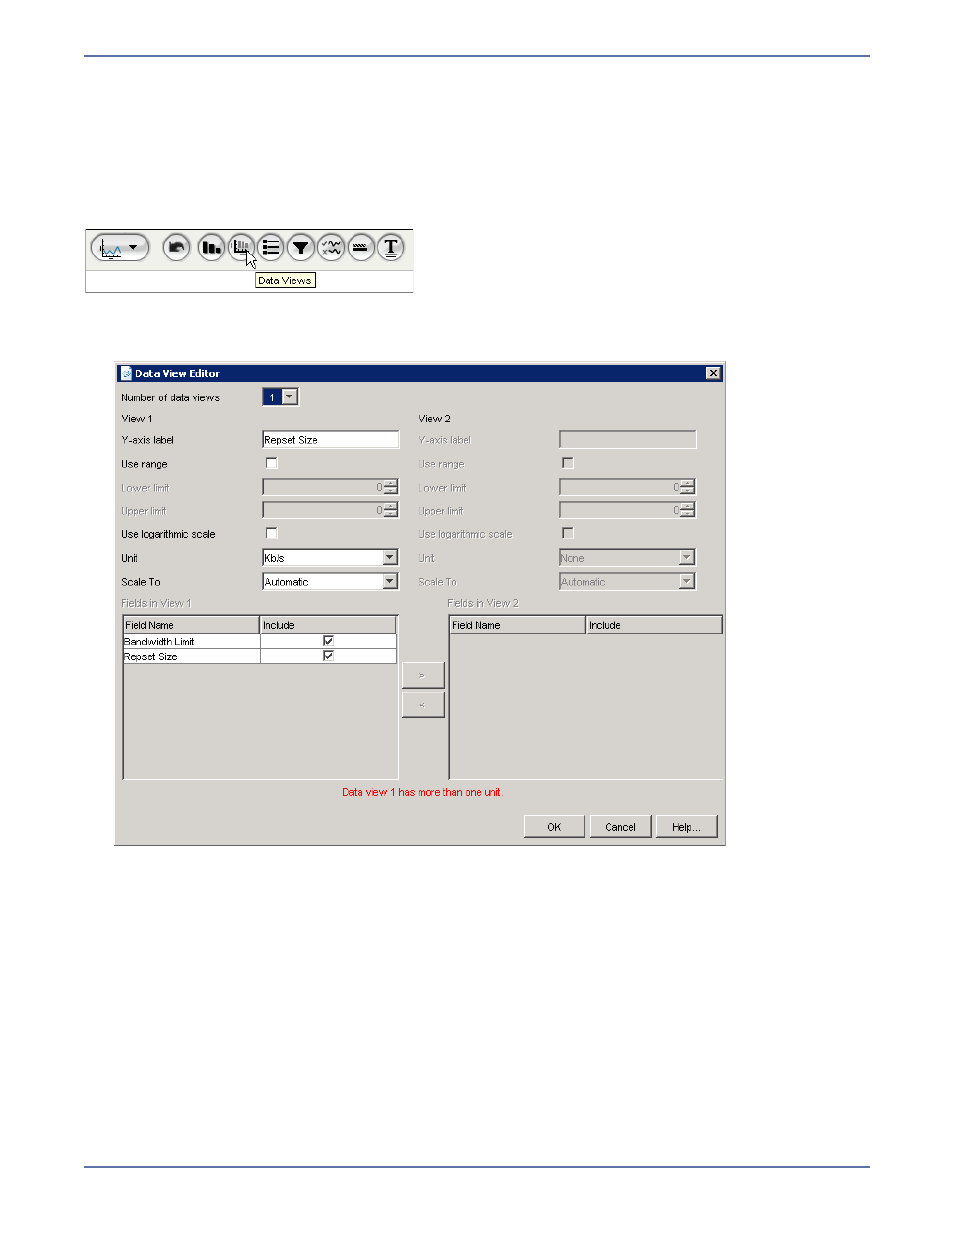
To edit data views:
1.
Click
Data Views icon. The Data View Editor appears.
2.
Specify the Data Views Editor fields that apply to your report.
z
Number of data views—The number of data views to plot. If the fields being plotted have
two different units, then the chart requires two data views. When two views are present the
settings for the second view are enabled.
z
Y-axis label—The title for y axis.
z
Use range—Use range sets the upper and lower limits for the y axis. Select this checkbox to
enable the
Lower limit and Upper limit fields.
z
Lower limit—Sets the lower limit for the y axis when range is enabled.
z
Upper limit—Sets the upper limit for the y axis when range is enabled.
z
Use logarithmic scale—If selected, the y axis is scaled logarithmically.