Configuring views, Navigating the console, Selecting a node – HP Storage Mirroring Software User Manual
Page 14: Selecting a report, Drilling down, Configuring views -5 navigating the console -5, Selecting a node -5, Selecting a report -5, Drilling down -5
3 - 5
Configuring views
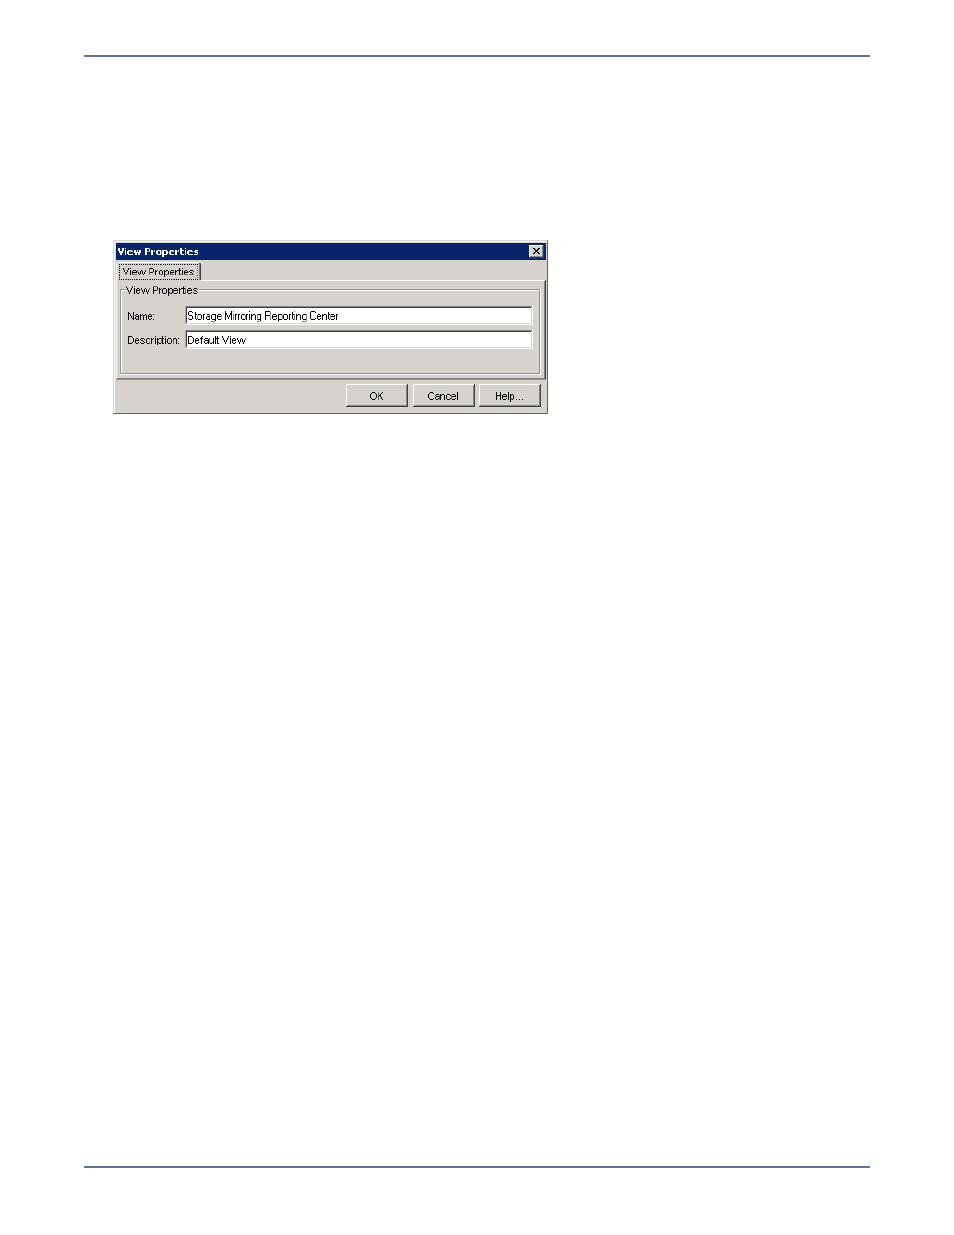
A view is the hierarchy of nodes and groups that are displayed in the navigation tree. The View
Properties dialog box displays the name and description of the Storage Mirroring Reporting Center
view. This name and description can be changed.
To change the name and description of the Storage Mirroring Reporting Center view:
1.
Select the Storage Mirroring Reporting Center folder. Right-click, and select
Configuration,
Properties from the menu. The View Properties dialog box appears.
2.
In the
Name field, enter the name of your view. The default value is Storage Mirroring
Reporting Center.
3.
In the
Description field, enter the description of your view.
4.
Click
OK.
Navigating the console
Selecting a node
To select a node, click on the node in the navigation tree. If necessary, expand the navigation tree
to find the node.
Selecting a report
To select a report:
1.
Right-click the node against which you want to run the report, and a menu displays your options.
2.
Select an item from the menu.
3.
The report runs (it may take a few seconds). While the report is running, the progress bar in the
bottom right of the dialog box moves to indicate that the report is in progress. When the report
completes, the report is displayed in the Report Display window.
Drilling down
When you run a report, you can drill down further to isolate problems or show more data about the
reported object. The way in which you drill down on data in reports depends on the type of report.
z
Trend chart drill down—Trend reports plot data sets in a line graph against time. You can drill
down on specific data by selecting the area of the chart and dragging the mouse on the chart area
over the region of interest.
Click inside the selected area. The information within the drill-down appears.
z
Zooming in on a chart section—Right-click the chart area, and if the chart supports it, a menu
displays alternate reports that you can run.
z
Opening dashboard reports—To drill down on a Dashboard summary report, click on the desired
report to open it in a new window.