Figure 2-2 – HP Matrix Operating Environment Software User Manual
Page 20
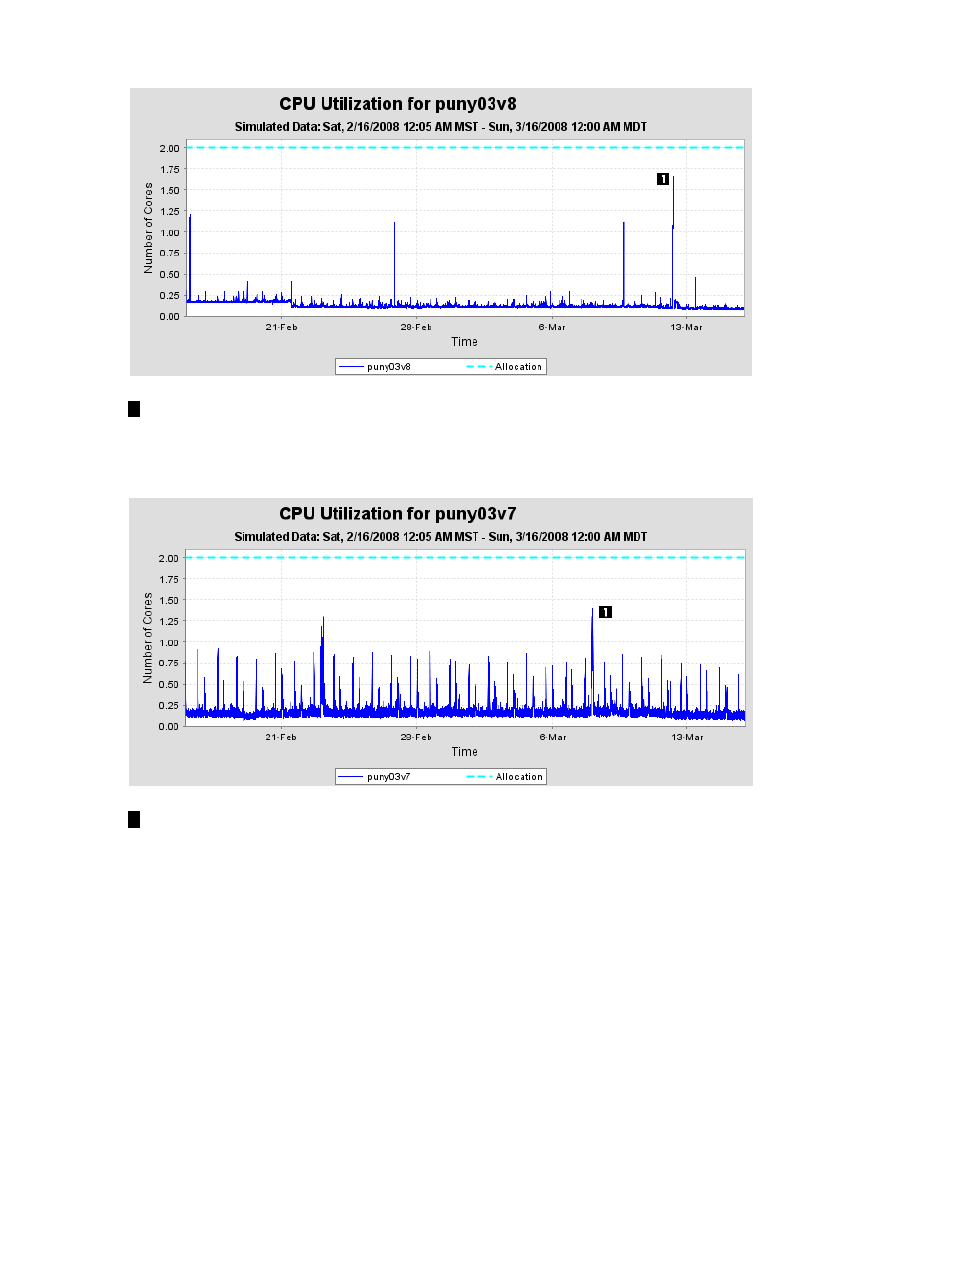
Figure 2-2 CPU utilization for managed system puny03v8
1
Peak (highest) value.
Similarly,
shows CPU utilization for a second system over the same period.
Figure 2-3 CPU utilization for managed system puny03v7
1
Peak value.
Comparing these two graphs shows that workload peaks on the two systems do not occur
simultaneously, nor do they require the same percentage of the allocated CPU cores for processing.
This suggests an opportunity to consider whether you can consolidate both systems together to
satisfy the needs of the workloads, while reducing the number of CPU cores (originally each
system is allocated 2 cores, for a total of 4 cores available to do work).
shows the result of using a Capacity Advisor “what-if” scenario to combine the
workloads onto one system.
20
Features
- Scripting Toolkit for Linux (68 pages)
- Scripting Toolkit for Windows 9.50 (62 pages)
- Scripting Toolkit for Windows 9.60 (62 pages)
- Storage Area Manager (13 pages)
- Core HP-UX (5 pages)
- Matrix Operating Environment Software (245 pages)
- Matrix Operating Environment Software (209 pages)
- Matrix Operating Environment Software (71 pages)
- Matrix Operating Environment Software (239 pages)
- Matrix Operating Environment Software (107 pages)
- Matrix Operating Environment Software (77 pages)
- Insight Management-Software (148 pages)
- Matrix Operating Environment Software (80 pages)
- Insight Management-Software (128 pages)
- Matrix Operating Environment Software (132 pages)
- Matrix Operating Environment Software (74 pages)
- Matrix Operating Environment Software (76 pages)
- Matrix Operating Environment Software (233 pages)
- Matrix Operating Environment Software (61 pages)
- Matrix Operating Environment Software (232 pages)
- Matrix Operating Environment Software (70 pages)
- Matrix Operating Environment Software (120 pages)
- Matrix Operating Environment Software (36 pages)
- Matrix Operating Environment Software (99 pages)
- Matrix Operating Environment Software (198 pages)
- Matrix Operating Environment Software (66 pages)
- Matrix Operating Environment Software (95 pages)
- Matrix Operating Environment Software (152 pages)
- Matrix Operating Environment Software (264 pages)
- Matrix Operating Environment Software (138 pages)
- Matrix Operating Environment Software (137 pages)
- Matrix Operating Environment Software (97 pages)
- Matrix Operating Environment Software (33 pages)
- Matrix Operating Environment Software (142 pages)
- Matrix Operating Environment Software (189 pages)
- Matrix Operating Environment Software (58 pages)
- Matrix Operating Environment Software (68 pages)
- Matrix Operating Environment Software (79 pages)
- Matrix Operating Environment Software (223 pages)
- Matrix Operating Environment Software (136 pages)
- Matrix Operating Environment Software (34 pages)
- Matrix Operating Environment Software (63 pages)
- Matrix Operating Environment Software (67 pages)
- Matrix Operating Environment Software (128 pages)