KANOMAX 3443 Digital Dust Monitor User Manual
Page 24
3. Display Description and operation Procedure
18
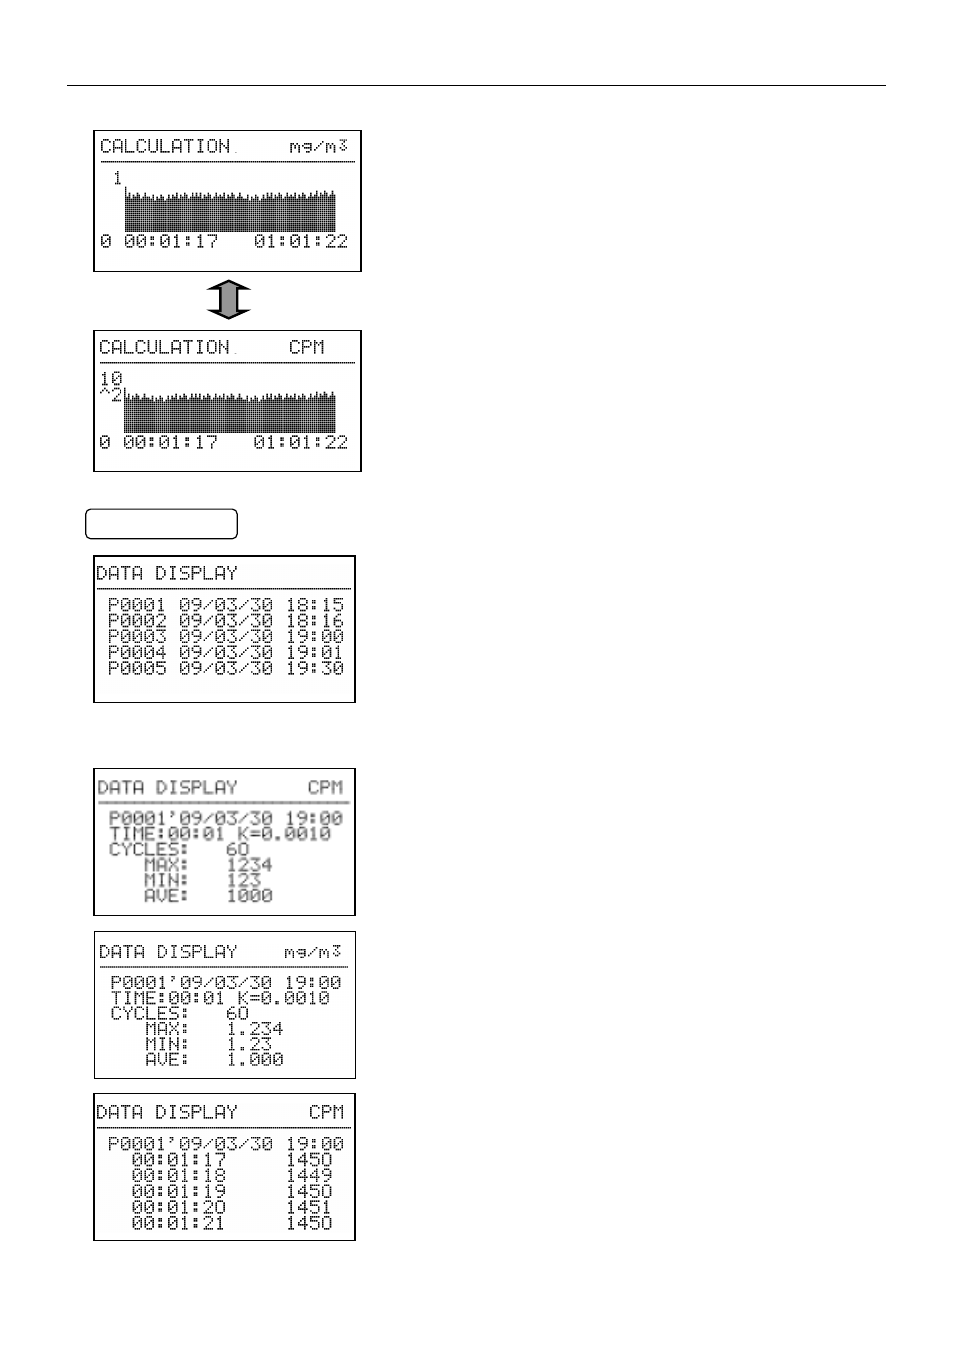
After a measurement, use [▲] [▼] keys to scroll the graph display.
The number of data points that can be displayed in one screen is 110.
To switch the graph display to the count display after a measurement,
press [MENU] key.
3.4.3 Data Display
Select DATA DISPLAY on the menu screen to display the data list
display screen shown on the left.
A list of data points taken in the CALCULATION MODE will be
displayed.
Use [▲] [▼] keys to move the cursor to the data point you want to
display, and press [SET] key to select it.
Press [MENU] key to go back to the menu screen.
The calculation result of the selected data point is displayed.
TIME:
Measurement
time
(MM:SS)
K:
K
Factor
CYCLES:
Number of measurement cycles
MAX:
Maximum
concentration
MIN: Minimum
concentration
AVE: Average
concentration
Press [SET] key to display a list of each measurement data.
Press [MENU] key to go back to the previous screen.
Each measurement data will be displayed.
A measurement data is displayed in one line in the order of the
measurement time and concentration (unit: CPM).
Press [▲] [▼] keys to scroll the screen.
Press [SET] key to display a graph.
Press [MENU] key to go back to the data list display screen.
Press [MENU] key