Charting batches, Printing – DeFelsko PosiTector 100 v.4.0 User Manual
Page 23
100 Series
Page 23
Charting Batches
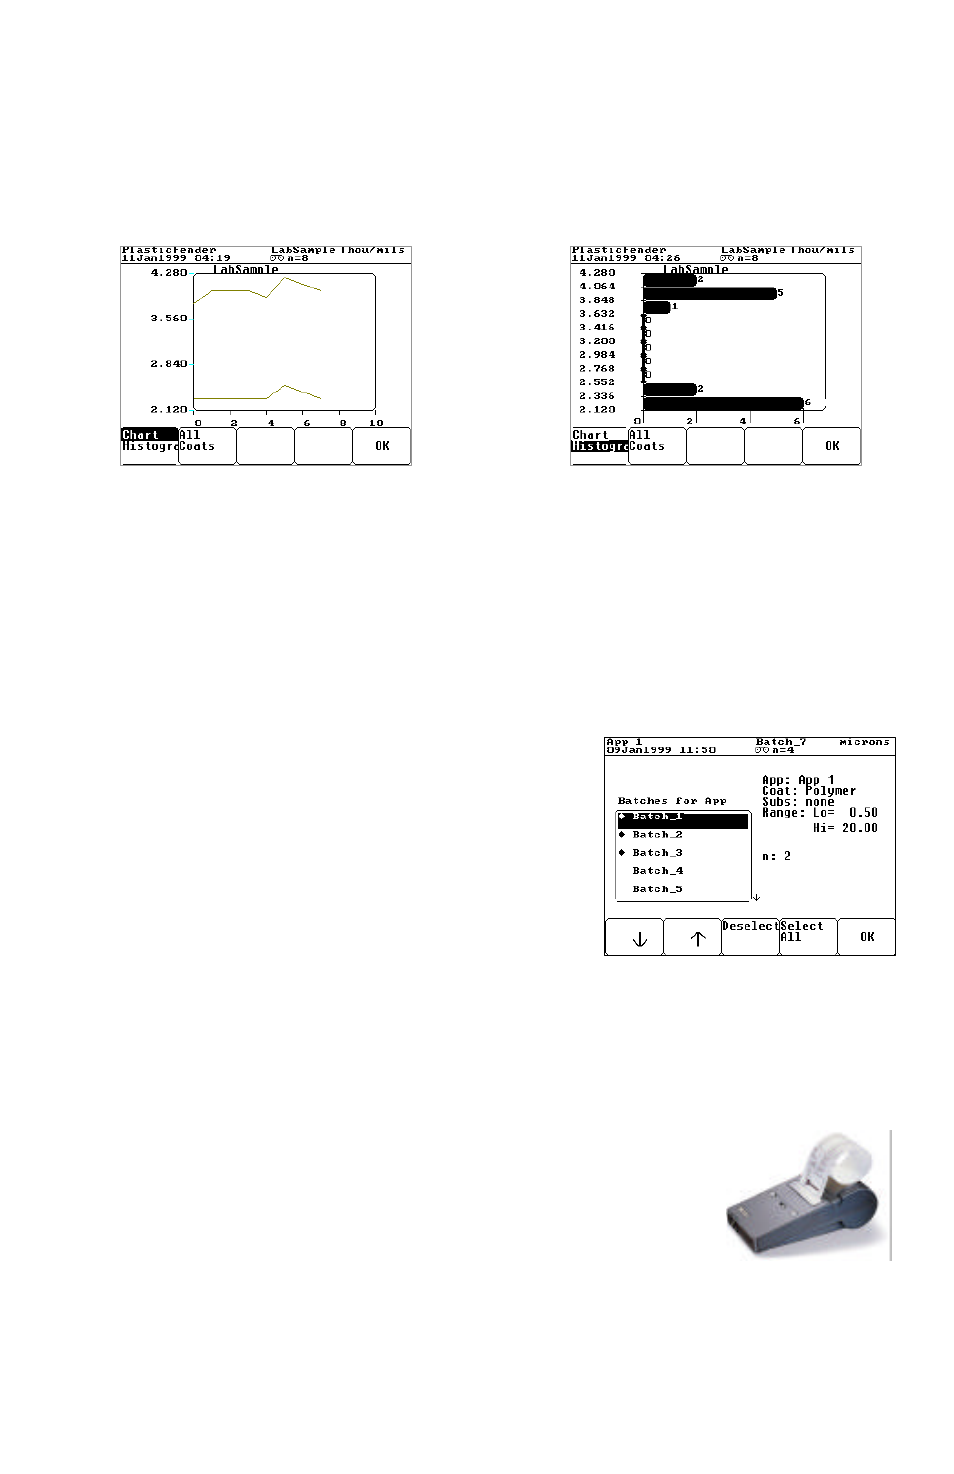
The contents of the current batch can be viewed in graphical format by selecting
the
Batch q
q Chart menu item. A line chart or histogram is available for a
single layer or for all coats.
Printing
Stored measurements (from one “application” at a time) can be sent formatted to
an infra-red or serial printer and can be captured by a Windows program such as
Windows HyperTerminal or MacTerminal. Measurements are not erased from
memory after being downloaded.
Choose the
Batch q
q Print menu item and select
the batch names you wish to group into a printout.
Press
OK and then select a printer option.
1. Select the
IR Printer option to print to the
Hewlett-Packard infra-red printer available
from your dealer. This portable, battery-
operated printer operates without wires, cables or connectors and is handy
for generating rapid, on-site printouts of stored measurements. Turn the
printer on and align it so that the Model 100’s red IR port is pointed at the
printer’s IR port at a distance of 6 inches (25cm) or less.
2. Select the
Serial Printer option to print to any serial printer connected to
the Gage using the supplied RS232 cable.
A sample printout can be found in Appendix B. Graphics are
not printed
The batch name is “LabSample”. The application
“PlasticFender” is set to measure two layers. Ten
readings were taken but two were deleted.