Hired-Hand HH Software: Farm Manager User Manual
Page 16
Part No. 4801-5049 Rev 8/05
Farm Manager
Page: 16
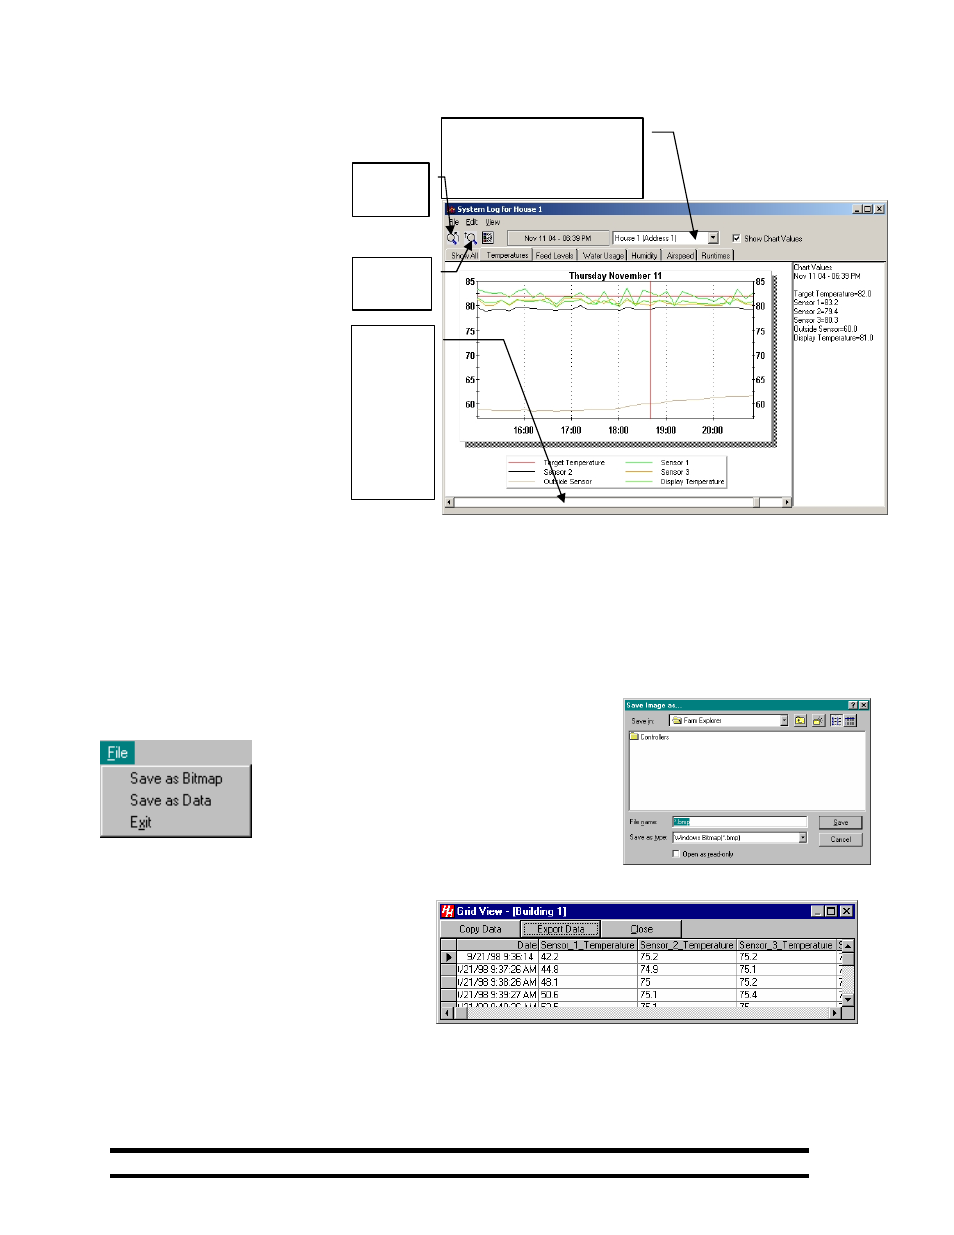
16.2 Expanding the View
In this view the plot of the above
file that has been expanded to start
at 15:00 hours on Thursday
November 11 and end at 22:00
hours. Note that the Horizontal
Scroll bar has been activated.
Multiple zoom levels can be
developed, using the tool bar Zoom
icons. The Up Zoom returns to the
previous zoom level. Reset Zoom
returns to the original plot. The
horizontal scroll bar will move the
chart to the right or left and display
the same time period in the view.
The current view can be further
expanded by placing the cursor at
the starting time at which the data
should be expanded, then holding
down the left mouse button and
dragging the mouse to the stop
time.
16.3 Display Menu Options
The following options control the display and storage of the temperature data.
File -
The File options provide two ways to save a display file:
Save as Bitmap – This options saves the view as a
bitmapped file that can be loaded into the Windows
Clipboard or other graphics capable programs such as
Microsoft’s WORD.
Save as Data – This option saves the view in a
standard database format that can be read by database programs such
as EXCEL.
Exit – Terminates the view of the
temperature data.
Save Image - When either of the two
Save as options are selected the Save
Image as... window appears. Select the
folder and type in a file name in the text
box.
Edit -
These Edit options are similar to the above File options except the data is copied to the Windows Clipboard.
View -
View in Grid – This option from the View menu shows the temperature data in chart format listing the
individual temperature data points from all the sensors and the time and date recorded.
Reset
Zoom
Selector allows navigation
between existing active
System logs.
The
horizontal
scroll bar
becomes
available
in a
Zoomed
view
Up Zoom
Level