Viewing the system log – Hired-Hand HH Software: Farm Manager User Manual
Page 15
Part No. 4801-5049 Rev 8/05
Farm Manager
Page: 15
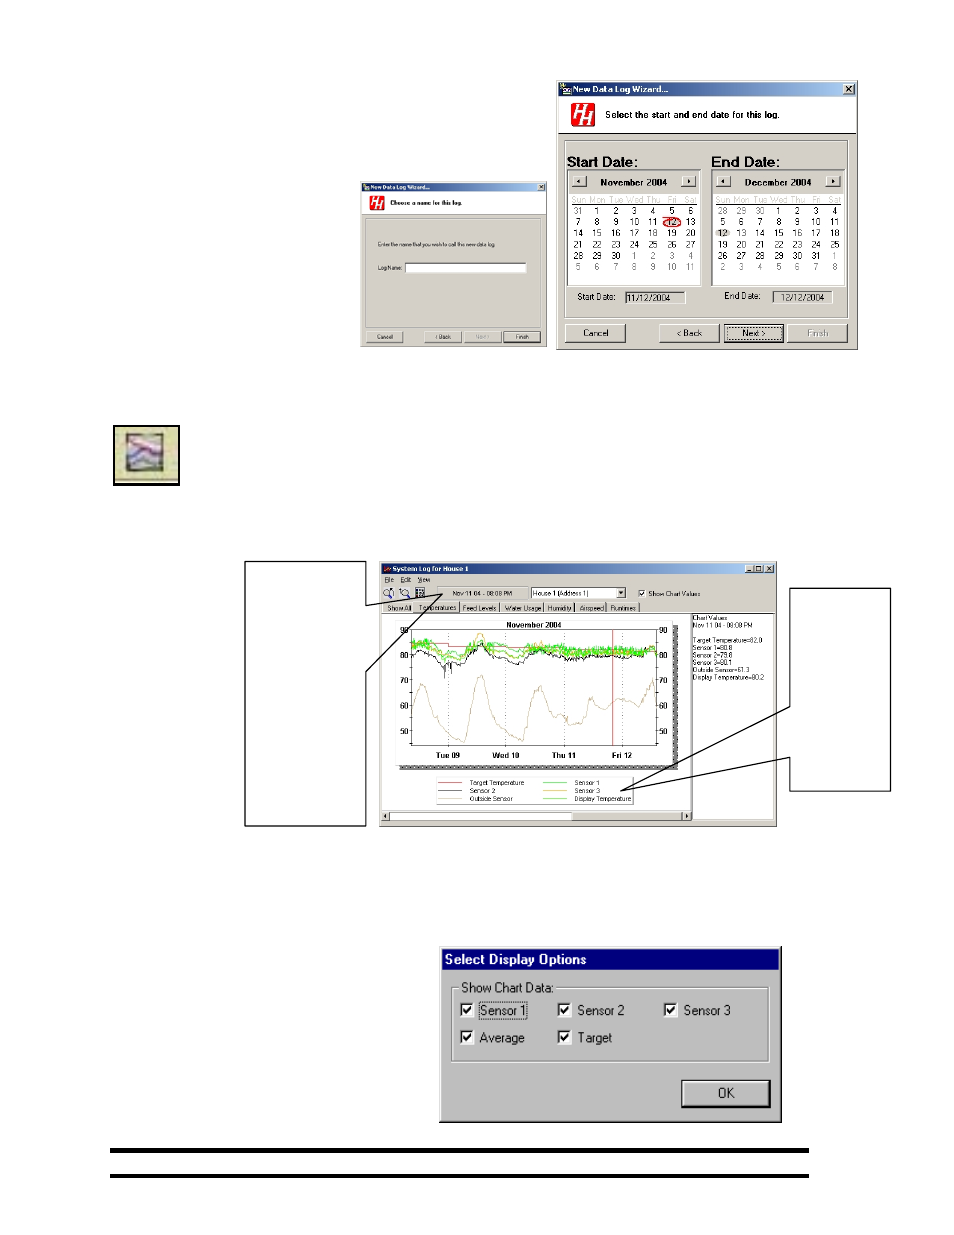
15.1 Log File Start/End Dates
Start/End Date –To set the starting and ending dates for
temperature recording use the drop-down menus to select the month
and year. The calendar for the selected month and year will be
shown on the screen. To select the Start or End Dates, click on the
desired day on the calendar.
Data logs that have End Dates that
have not passed are placed in Active
folders. Conversely, files that have
End Dates that have passed are
placed in Inactive folders.
The user selection is shown in the
Start/End Date text boxes. Selecting
Next> brings up the Log Name
window.
16. Viewing the System Log
The “System Log” can be viewed by selecting the desired Evolution control and clicking on the “View
System Log” tool bar button. Farm Manager contains many options for viewing and printing the
recorded temperature and other sensor data. First locate the desired log file from the Farm Manager
Main screen. Double click on the file icon. Farm Manager will plot all of the data as in the example
below. The following plot is for House 1 contains temperature sensor data taken over a five day period.
The temperature data is initially plotted from the first data point to the last recorded point. However, there are
zoom-in and
zoom-out icons in
the menu bar for
viewing specific
sections of the
recorded data.
The Properties
Display Options
allow selection of
specific sensor
data to be
displayed.
The temperature selection for this example was selected a Fahrenheit degrees. See Section 21 for changing this
scale to Celsius.
16.1 Properties - Select Display Options
Clicking on the Options control button
brings up the Select Display Options
window. From the Show Chart Data, any
or all the data can be plotted at the same
time. To implement any changes, click the
OK button.
Shows the
current data
plotted,
based on
the
selections
made from
the
Properties
window
As the red
cursor is
moved across
the plot, the
time and
temperature of
a sensor is
displayed here.
The
corresponding
sensor values
are displayed
at the bottom
of the chart.