General – Atec Agilent-8480 Series User Manual
Page 10
10
The chart in Figure 1 shows the typical
uncertainty in making a relative power
measurement, using the same power
meter channel and the same power
sensor to obtain the reference and the
measured values. Example A illustrates
a relative gain (amplifier measure-
ment). Example B illustrates a relative
loss (insertion loss measurement). This
chart assumes negligible change in
frequency and mismatch occur when
transitioning from the power level used
as the reference to the power level
being measured.
Example A:
P = 10(P)/10 x 1 mW
P = 10 6/10 x 1 mW
P = 3.98 mW
3% x 3.98 mW = 119.4 µW
(where P = power in Watts,
and (P) = power in dBm)
Example B:
P = 10 (P)/10 x1 mW
P = 10 -35/10 x 1 mW
P = 316 nW
3% x 316 nW = 9.48nW
General
Dimensions:
E4412A:
130 mm L x 38 mm W x 30 mm H
(5.1 in x 1.5 in x 1.2 in)
E4413A:
102 mm L x 38 mm W x 30 mm H
(4 in x 1.5 in x 1.2 in)
Weight:
E4412A: 0.18 kg (0.4 lb).
E4413A: 0.18 kg (0.4 lb).
Calibration Factor (CF) and
Reflection Coefficient (Rho)
Calibration Factor and Reflection Coefficient data are provided at 1 GHz
increments on a data sheet included with the power sensor. This data is unique
to each sensor. If you have more than one sensor,match the serial number on
the data sheet with the serial number on the power sensor you are using. The CF
corrects for the frequency response of the sensor. The EPM power meter auto-
matically reads the CF data stored in the sensor and uses it to make the
corrections. For power levels greater than 0 dBm, add 0.5%/dB to the calibration
factor uncertainty specification.
Reflection Coefficient (Rho) relates to the SWR according to the following
formula:
SWR = 1 + Rho/1 - Rho
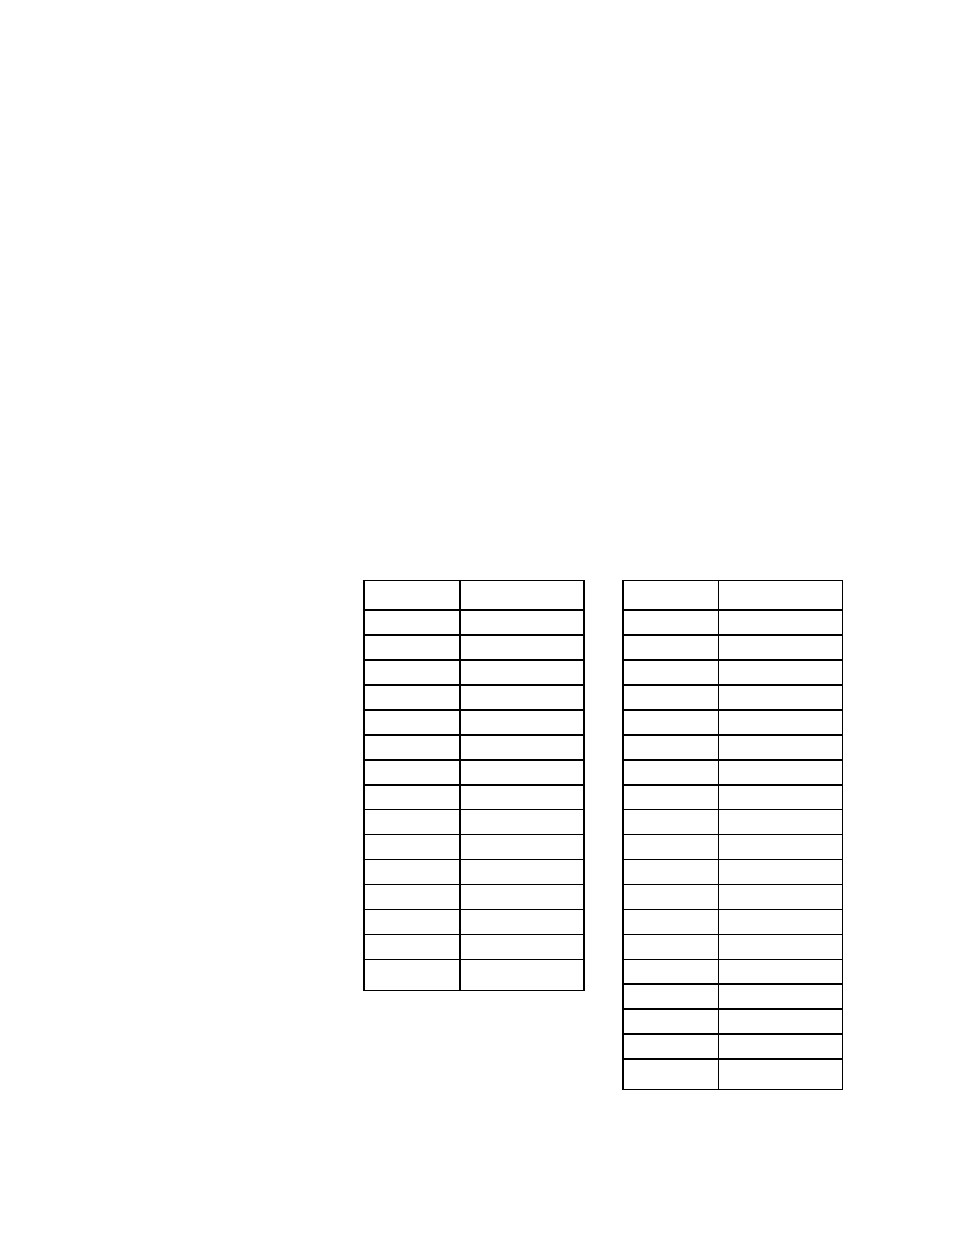
Maximum uncertainties of the CF data are listed in Table 8a, for the E4412A
power sensor, and Table 8b for the E4413A power sensor. The uncertainty
analysis for the calibration of the sensors was done in accordance with the
ISO/TAG4 Guide. The uncertainty data reported on the calibration certificate is
the expanded uncertainty with a 95% confidence level and a coverage factor of 2.
Table 8a
E4412A Calibration Factor
Uncertainty at 1mW (0dBm)
Table 8b
E4413A Calibration Factor
Uncertainty at 1mW (0dBm)
Frequency
Uncertainty (%)
10 MHz
1.8
30 MHz
1.8
50 MHz
Reference
100 MHz
1.8
1.0 GHz
1.8
2.0 GHz
2.4
4.0 GHz
2.4
6.0 GHz
2.4
8.0 GHz
2.4
10.0 GHz
2.4
11.0 GHz
2.4
12.0 GHz
2.4
14.0 GHz
2.4
16.0 GHz
2.6
18.0 GHz
2.6
Frequency
Uncertainty (%)
50 MHz
Reference
100 MHz
1.8
1.0 GHz
1.8
2.0 GHz
2.4
4.0 GHz
2.4
6.0 GHz
2.4
8.0 GHz
2.4
10.0 GHz
2.6
11.0 GHz
2.6
12.0 GHz
2.8
14.0 GHz
2.8
16.0 GHz
2.8
17.0 GHz
2.8
18.0 GHz
2.8
20.0 GHz
3
22.0 GHz
3
24.0 GHz
3
26.0 GHz
3
28.0 GHz
3