Characteristic curves, Austin lynx, Continued) – GE Industrial Solutions Austin Lynx 24V User Manual
Page 9
Data Sheet
September 10, 2013
Austin Lynx
TM
24V: Non-isolated Power Modules:
18/20– 30/32Vdc input; 3 – 6Vdc & 5 – 15Vdc Output; 30/50W
LINEAGE
POWER
9
Characteristic Curves
(continued)
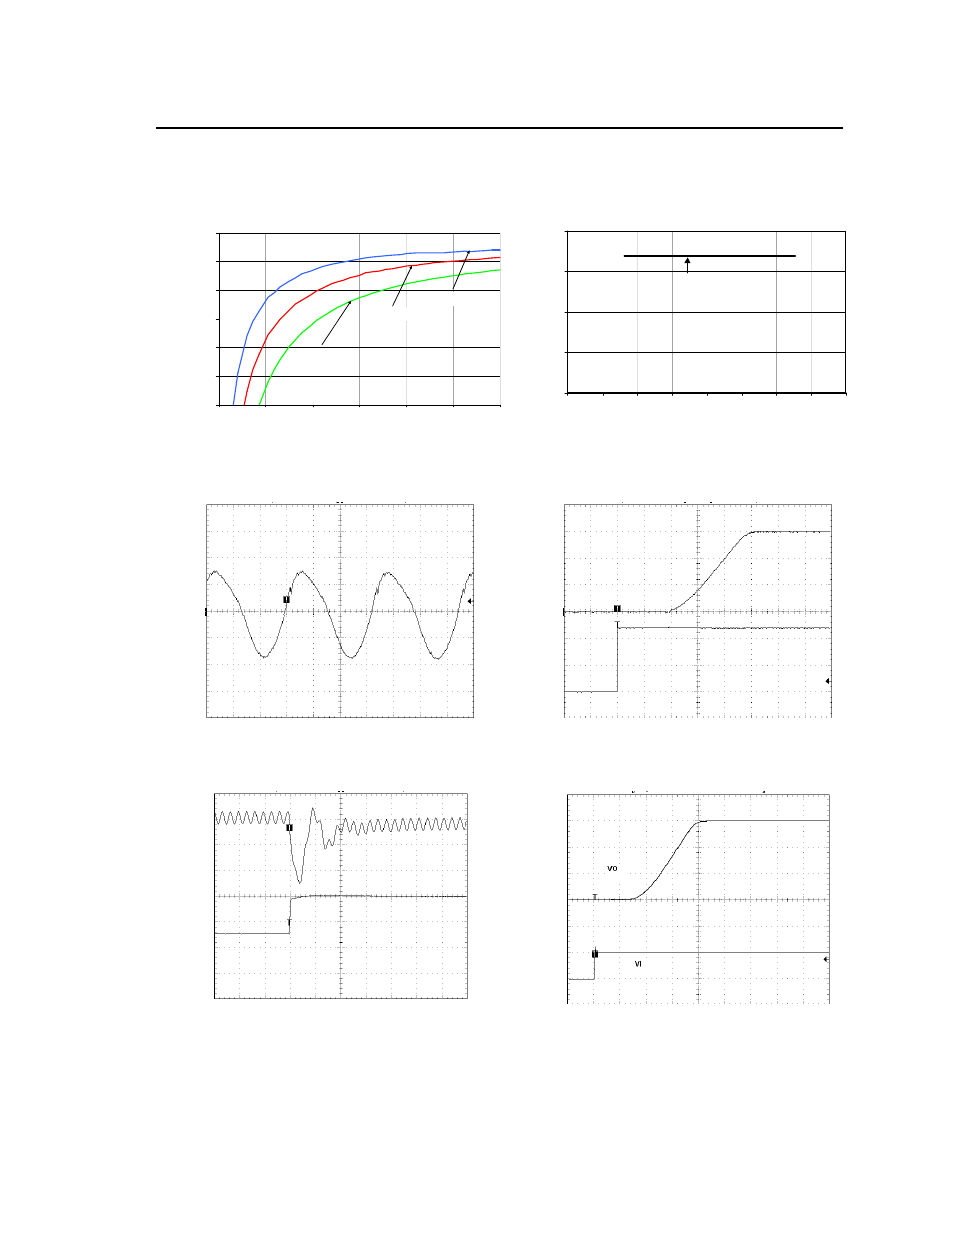
The following figures provide typical characteristics for the AXB050X module at 15V, 3A and 25
o
C.
E
FFI
CIE
N
C
Y
, η
(%)
70
75
80
85
90
95
100
0
0.5
1
1.5
2
2.5
3
Vin=30V
Vin=24V
Vin=20V
O
U
TPU
T
CUR
RE
NT
, Io
(A
)
0
1
2
3
4
20
30
40
50
60
70
80
90
100
NC
OUTPUT CURRENT, I
O
(A)
AMBIENT TEMPERATURE, T
A
O
C
Figure 19. Converter Efficiency versus Output Current.
Figure 22. Derating Output Current versus Local
Ambient Temperature and Airflow.
O
U
T
P
UT
VO
LT
AG
E
V
O
(V
) (2
0m
V
/d
iv
)
O
n/O
ff
VO
LTAGE
O
U
TPU
T
V
O
LT
A
G
E
V
On
/o
ff
(
V
) (1
0V
/d
iv
)
V
O
(V
) (5
V
/di
v)
TIME, t (1
μs/div)
TIME, t (2ms/div)
Figure 20. Typical output ripple and noise (V
IN
=
V
IN,NOM
, I
o
= I
o,max
).
Figure 23. Typical Start-up Using Remote On/Off
(V
IN
= V
IN,NOM
, I
o
= I
o,max
).
OU
TPU
T
CU
RR
E
N
T,
OU
T
P
U
T
VO
LT
AG
E
I
O
(
A
) (1
A
/d
iv)
V
O
(V
) (5
0m
V
/d
iv)
IN
P
U
T
VO
LT
AG
E
O
U
T
P
UT
V
O
LT
A
G
E
V
IN
(V
) (
2
0V
/d
iv
)
V
O
(V
) (5
V
/d
iv
)
TIME, t (10
μs /div)
TIME, t (2.5ms/div)
Figure 21. Transient Response to Dynamic Load
change from 50% to 100% of full load with di/dt of
5A/
μs.
Figure 24. Typical Start-up Using Input Voltage (V
IN
= 20V, I
o
= I
o,max
).