Ocean Optics SpecLine Offline Spectroscopy User Manual
Page 19
A: Reference
041-00000-010-02-1209
13
Field
Description
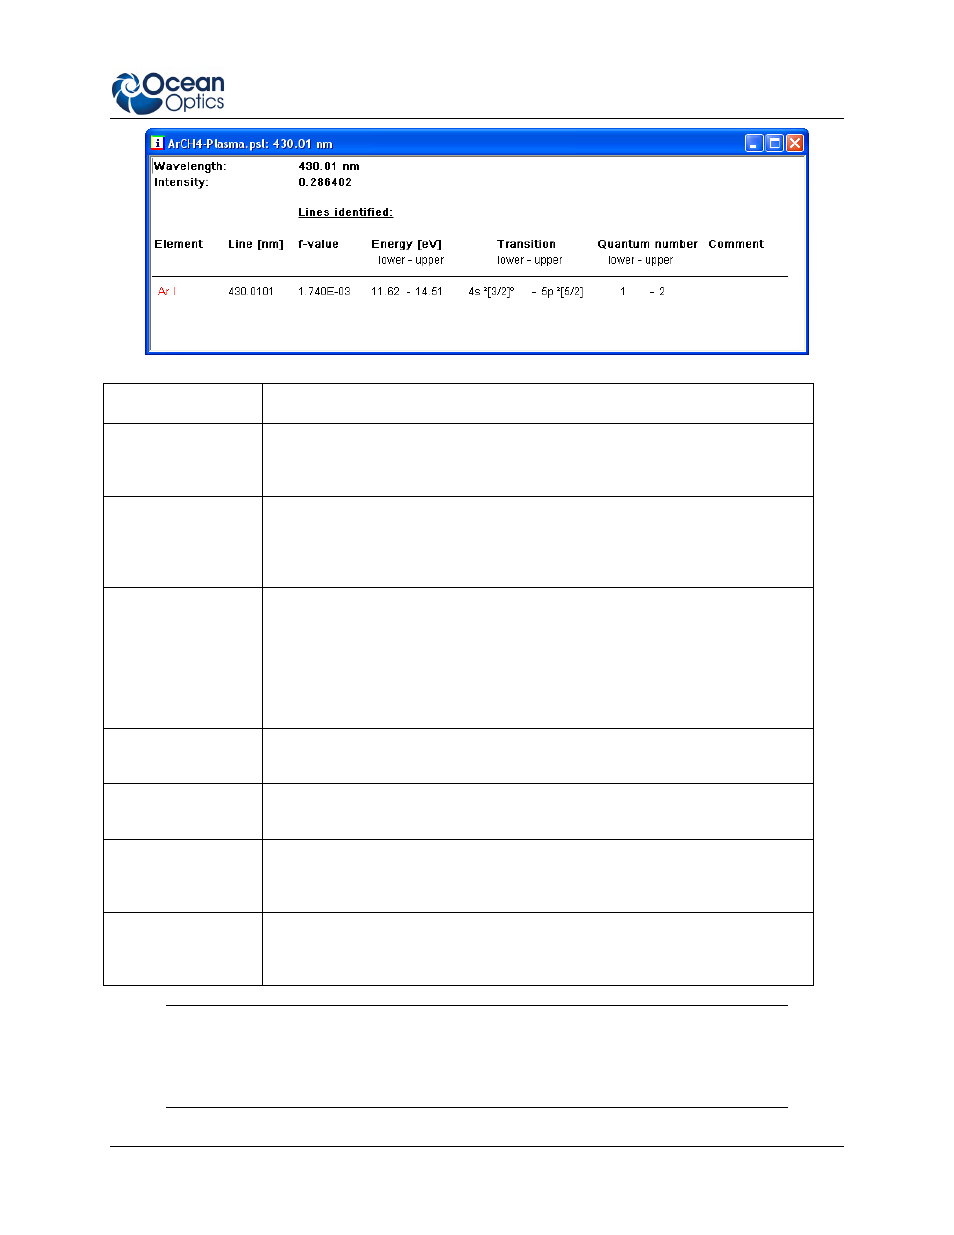
Element
Lists the element name and ionization state in spectroscopic notation for
each identified line or band. The color of the entry corresponds to the color of
the element in the diagram window.
Line (nm)
This is the exact wavelength of the identified line or band from the database.
If several lines or bands of the same element were found, the strongest line
is marked with an asterisk (*). Only this line is displayed in the diagram
window.
Line Strength
(f-value)
Depending on your selection the line strength is displayed in relative units, in
f-values (oscillator strength) or A
ik
-values (transition probabilities).
The line strength in relative units is related to the f-value of the atomic line. A
relative line strength of 1000 corresponds to an f-value of 1. If no data is
available for an element, the relative line strengths are normalized to the
strongest line or band that is set to 1000.
Energy (eV)
The energy in electron volt (eV) of the lower level (left column) and of the
upper level (right column) involved in the transition.
Transition
The notation of the transition with the lower electronic state (left column) and
the upper electronic state (right column).
Quantum number
The quantum numbers of the lower level (left column) and of the upper level
(right column) involved in the transition. For atoms the quantum number J,
and for molecules the vibrational quantum number v is given.
Comment
Additional information concerning the transition. Information (especially for
molecules) regarding band heads and rotational branches are given in this
column.
Note
The table can be printed and copied to the clipboard for further processing in other
programs. The table can also be saved as an RTF or an ASCII file.