Enabling and disabling monitoring, Table 18–24, Jvm statistics for java se - threads – Sun Microsystems GLASSFISH ENTERPRISE 820433510 User Manual
Page 191: Enabling and disabling monitoring” on
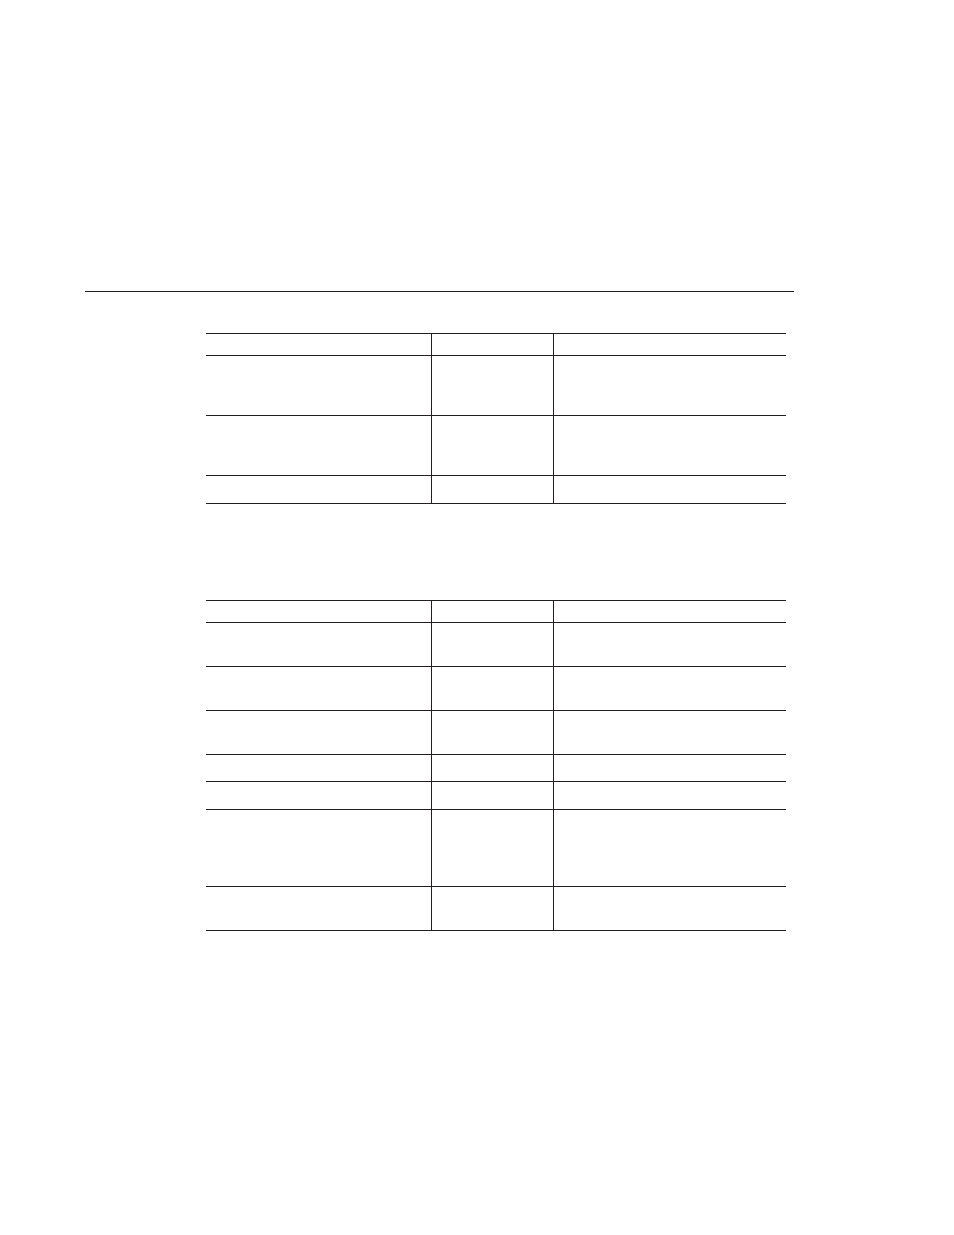
TABLE 18–23
JVM Statistics for Java SE - Thread Info
(Continued)
Statistic
Data Type
Description
lockownerid
CountStatistic
ID of the thread that holds the monitor
lock of an object on which this thread is
blocking.
lockownername
StringStatistic
Name of the thread that holds the monitor
lock of the object this thread is blocking
on.
stacktrace
StringStatistic
Stack trace associated with this thread.
The statistics available for threads in the JVM in Java SE are shown in the following table.
TABLE 18–24
JVM Statistics for Java SE - Threads
Statistic
Data Type
Description
threadcount
CountStatistic
Current number of live daemon and
non-daemon threads.
peakthreadcount
CountStatistic
Peak live thread count since the JVM
started or the peak was reset.
totalstartedthreadcount
CountStatistic
Total number of threads created and/or
started since the JVM started.
daemonthreadcount
CountStatistic
Current number of live daemon threads.
allthreadids
StringStatistic
List of all live thread ids.
currentthreadcputime
CountStatistic
CPU time for the current thread (in
nanoseconds) if CPU time measurement is
enabled. If CPU time measurement is
disabled, returns -1.
monitordeadlockedthreads
StringStatistic
List of thread ids that are monitor
deadlocked.
Enabling and Disabling Monitoring
This section contains the following topics:
■
“Configuring Monitoring Levels Using the Admin Console” on page 192
■
“To Configure Monitoring Levels Using asadmin” on page 192
Enabling and Disabling Monitoring
Chapter 18 • Monitoring Components and Services
191