Thread pools statistics, Transaction service statistics, Table 18–14 – Sun Microsystems GLASSFISH ENTERPRISE 820433510 User Manual
Page 186: Thread pool statistics, Table 18–15
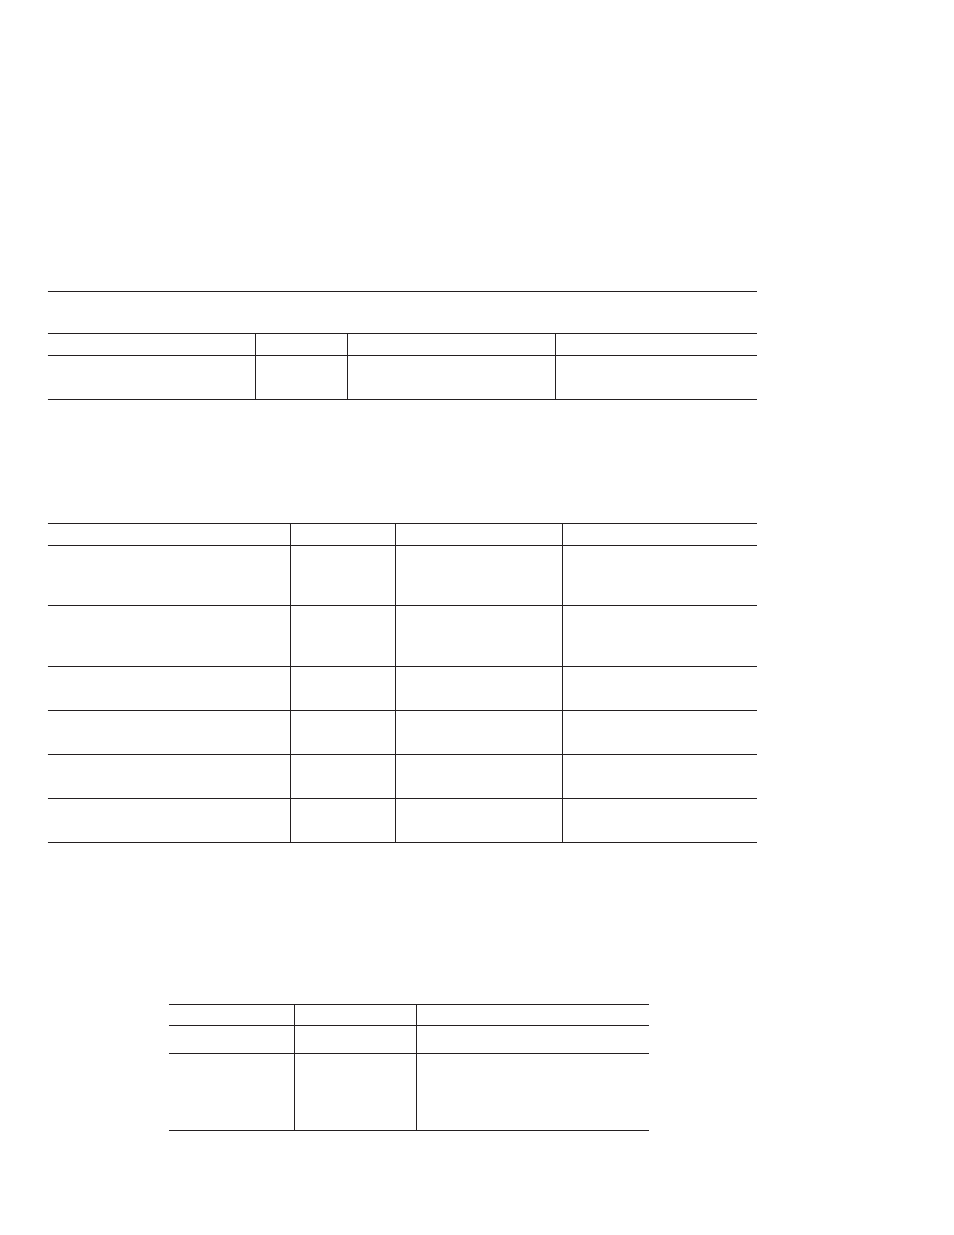
TABLE 18–13
Connection Manager (in an ORB) Statistics
(Continued)
Statistic
Units
Data Type
Description
totalconnections
Number
BoundedRangeStatistic
Total number of connections to the
ORB.
Thread Pools Statistics
The statistics available for the thread pool are shown in the following table.
TABLE 18–14
Thread Pool Statistics
Statistic
Units
Data Type
Description
averagetimeinqueue
Milliseconds
RangeStatistic
The average amount of time in
milliseconds a request waited in
the queue before getting processed.
averageworkcompletion-time
Milliseconds
RangeStatistic
The average amount of time taken
to complete an assignment, in
milliseconds.
currentnumberofthreads
Number
BoundedRangeStatistic
Current number of request
processing threads.
numberofavailablethreads
Number
CountStatistic
The number of threads that are
available.
numberofbusythreads
Number
CountStatistic
The number of threads that are
busy.
totalworkitemsadded
Number
CountStatistic
The total number of work items
added so far to the work queue.
Transaction Service Statistics
The transaction service allows the client to freeze the transaction subsystem in order to roll back
transactions and determine the transactions that are in process at the time of the freeze. The
statistics available for the transaction service are shown in the following table.
TABLE 18–15
Transaction Service Statistics
Statistic
Data Type
Description
activecount
CountStatistic
Number of transactions currently active.
activeids
StringStatistic
The ID’s of the transactions that are
currently active. Every such transaction
can be rolled back after freezing the
transaction service.
About Monitoring
Sun GlassFish Enterprise Server 2.1 Administration Guide • December 2008
186