Web container statistics, Table 18–6, Timer statistics – Sun Microsystems GLASSFISH ENTERPRISE 820433510 User Manual
Page 180: Table 18–7, Web container (servlet) statistics
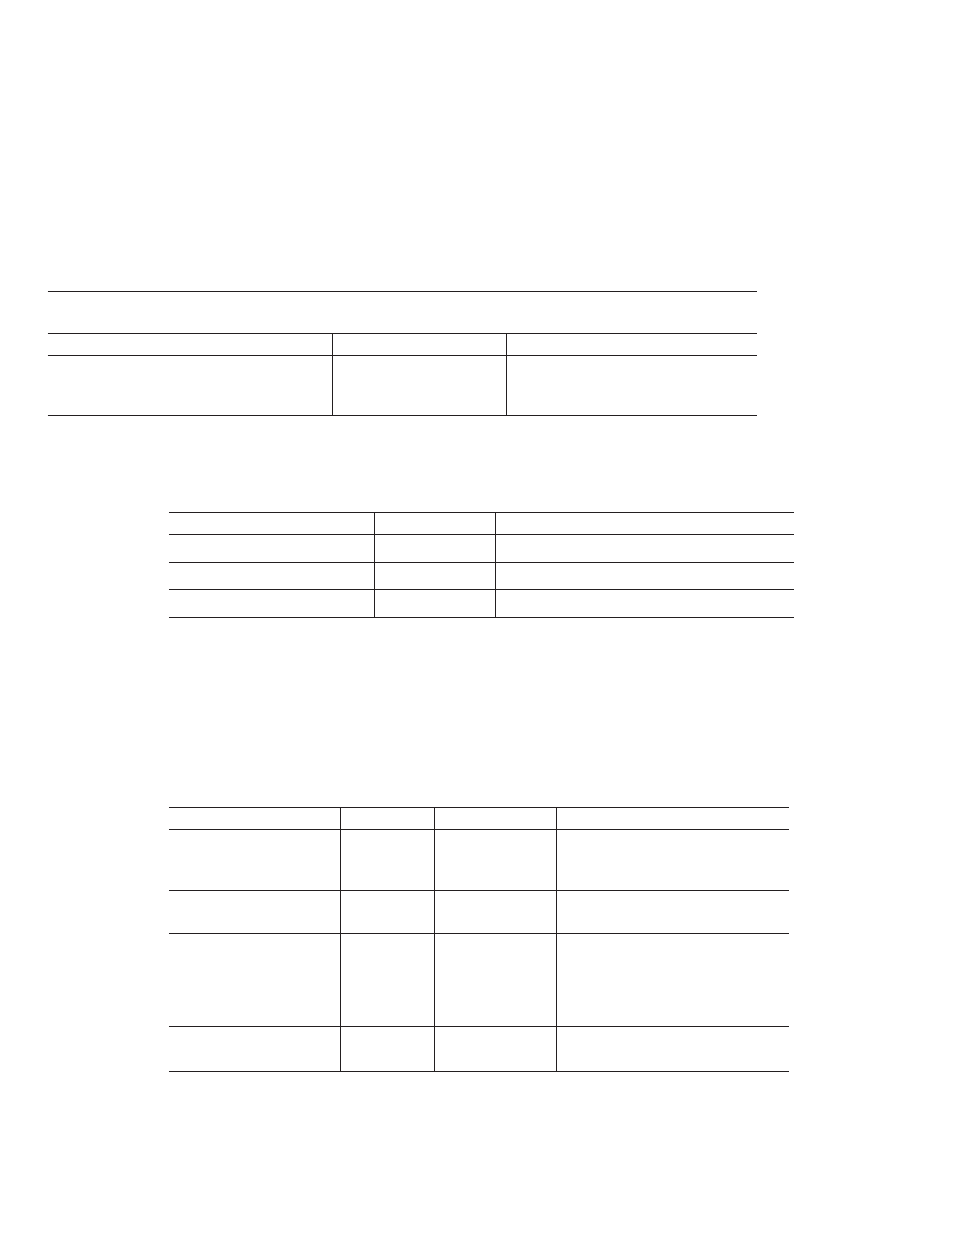
TABLE 18–5
EJB Cache Statistics
(Continued)
Attribute Name
Data Type
Description
numpassivationsuccess
CountStatistic
Number of times passivation completed
successfully. Applies only to stateful session
beans.
The statistics available for Timers are listed in the following table.
TABLE 18–6
Timer Statistics
Statistic
Data Type
Description
numtimerscreated
CountStatistic
Number of timers created in the system.
numtimersdelivered
CountStatistic
Number of timers delivered by the system.
numtimersremoved
CountStatistic
Number of timers removed from the system.
Web Container Statistics
The web container fits into the tree of objects as shown in
“The Applications Tree” on page 172
Web container statistics are displayed for each individual web application. Statistics available
for the web container for servlets are shown in
, and statistics available for web
modules are shown in
TABLE 18–7
Web Container (Servlet) Statistics
Statistic
Units
Data Type
Comments
errorcount
Number
CountStatistic
Cumulative number of cases where the
response code is greater than or equal to
400.
maxtime
Milliseconds
CountStatistic
The maximum amount of time the web
container waits for requests.
processingtime
Milliseconds
CountStatistic
Cumulative value of the amount of time
required to process each request. The
processing time is the average of request
processing times divided by the request
count.
requestcount
Number
CountStatistic
The total number of requests processed so
far.
Statistics available for web modules are shown in
“Web Container Statistics” on page 180
About Monitoring
Sun GlassFish Enterprise Server 2.1 Administration Guide • December 2008
180